Notice: Undefined index: c in /var/www/html/examples/examples.php on line 1125
Example of DFD for Online Store (Data Flow Diagram) | Data Flow Diagrams | Data Flow Diagram Example | Data Store Visio
This site uses cookies. By continuing to browse the ConceptDraw site you are agreeing to our Use of Site Cookies.

Example of DFD for Online Store (Data Flow Diagram)

Data Flow Diagram (DFD) is a methodology of graphical structural analysis and information systems design, which describes the sources external in respect to the system, recipients of data, logical functions, data flows and data stores that are accessed. DFDs allow to identify relationships between various system's components and are effectively used in business analysis and information systems analysis. They are useful for system’s high-level details modeling, to show how the input data are transformed to output results via the sequence of functional transformations. For description of DFD diagrams are uses two notations — Yourdon and Gane-Sarson, which differ in syntax. Online Store DFD example illustrates the Data Flow Diagram for online store, the interactions between Customers, Visitors, Sellers, depicts User databases and the flows of Website Information. ConceptDraw DIAGRAM enhanced with Data Flow Diagrams solution lets you to draw clear and simple example of DFD for Online Store using special libraries of predesigned DFD symbols.
Steps to Creating a Sales Process Flow Chart

Data Flow Diagrams

Data Flow Diagram (DFD) is a special chart type which lets graphically illustrate the "flow" of data through an information system. So the Data Flow Diagrams can be successfully used for visualization of data processing or structured design, for creation an overview of the system, for business process modeling, for exploring the high-level design in terms of data flows and documenting the major data flows. Inclusion of powerful Data Flow Diagrams solution to the Software Development area of ConceptDraw Solution Park makes the ConceptDraw DIAGRAM a beneficial data flow diagramming software and supplies it with numerous collection of quick-start templates, professionaly designed samples, and extensive range of ready-for-use vector objects consisting the Data Flow Diagrams, Gane-Sarson Notation, and Yourdon and Coad Notation libraries. Use the ConceptDraw DIAGRAM application to design easy and quickly the Data Flow Diagrams including the data storages, data flows, external entities, functional transforms, control transforms and signals.

Data Flow Diagram Example

ConceptDraw DIAGRAM extended with Data Flow Diagrams solution is the best diagramming and vector drawing software for quick and easy designing the Data Flow Diagram Example of any complexity.

Data Flow Diagram Symbols. DFD Library

Data Flow Diagrams graphically represent the information transfers and process steps of a system. They visually depict how data are processed by a system in terms of inputs and outputs, how occurs the input in a system, how the data flow through an information system and where they are stored, and how occurs output from the system. DFDs give the overview of the system and models the processes aspects, they are maintained with other methods of structured systems analysis. The main goal of DFDs is achievement of understanding between developers and users. For their construction are used two notations - Gane-Sarson and Yourdon, each of them uses its own set of symbols. Data Flow Diagrams solution from Software Development area extends the ConceptDraw DIAGRAM software with templates, samples, and predesigned libraries of data flow diagram symbols for both notations, allowing you easy design the process-oriented and data-oriented models, draw the Data Flow Diagrams, Data Flowcharts, Data Process Diagrams, Information Flow Diagrams, Structured Analysis Diagrams, etc.

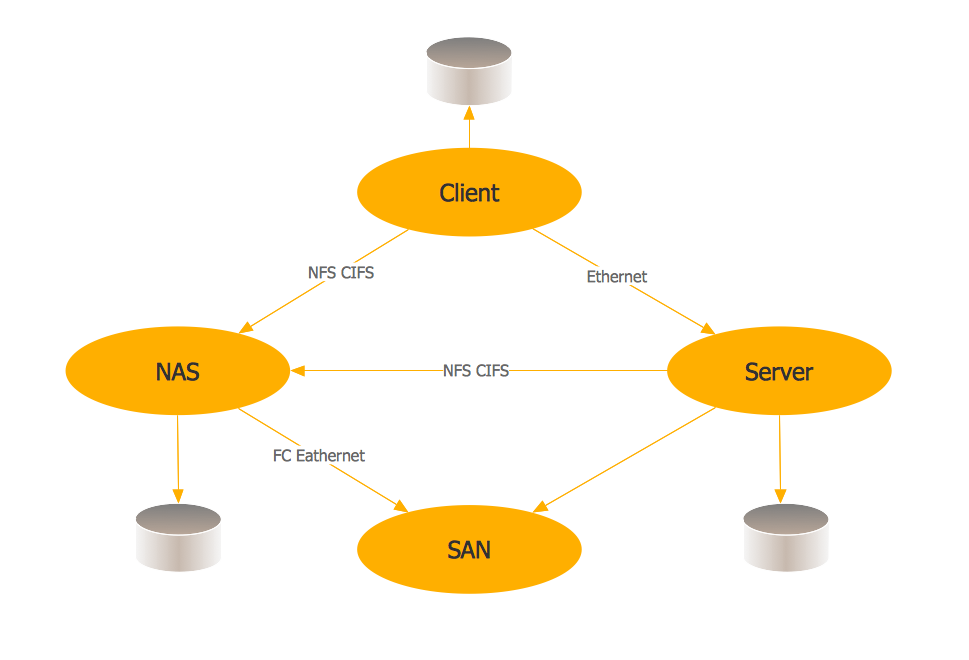
Storage area networks (SAN). Computer and Network Examples
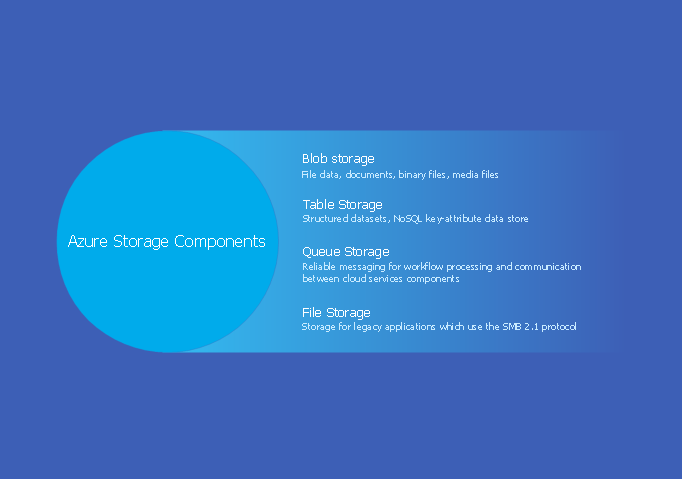
A Storage area network (SAN) is a dedicated network that provides access to data storage and operations only on the block level. SAN usually has own network of storage devices/elements and disk arrays that are connected with each other and to a remote data-sharing network. SANs are widely used for enhancing the storage devices (optical jukeboxes, disk arrays, tape libraries) that are accessible for networked servers. This example was created in ConceptDraw DIAGRAM using the Computer and Networks Area of ConceptDraw Solution Park. It shows the hybrid of Storage area network (SAN) and Network Attached Storage (NAS) technologies.

Azure Storage

Data storage is a fundamental aspect of the cloud platform. Microsoft offers scalable, durable and elastic cloud Azure Storage which can be available from any type of application whether it’s running in the cloud and anywhere in the world. ConceptDraw DIAGRAM diagramming and vector drawing software extended with Azure Architecture Solution from the Computer and Networks area of ConceptDraw Solution Park provides a lot of useful tools which give you the possibility effectively illustrate Microsoft Azure cloud system, Azure services, Azure storage and its components.

Data Flow Diagram

Data Flow Diagram (DFD) is the part of the Structured Systems Analysis and Design Methodology (SSADM), which is intended for information systems projection and analysis. Data Flow Diagrams allow graphically represent the data flows in information system and analyze the data processing during the structural projection. This type of diagrams lets visually show a work of information system and results of this work, it is often used in connection with human processes and can be displayed as Workflow diagram. Data Flow Diagram visualizes processes and functions, external entities, data depositories, and data flows connecting these elements and indicating direction and data character. Each of these elements used for DFD has its own graphical notation. There are two notations to draw DFDs - Yourdon & Coad and Gane & Sarson. ConceptDraw DIAGRAM extended with Data Flow Diagrams (DFD) solution from Software Developmant area is ideal for designing professional looking DFDs, which can be then easily exported in various formats.

Structured Systems Analysis and Design Method (SSADM) with ConceptDraw DIAGRAM

Structured Systems Analysis and Design Method (abbr. SSADM) is a method developed in Great Britain and accepted in 1993 as a national standard for information systems development and analysis. SSADM is based on Data Flow Diagrams and is characterized with presence of clear sequence of steps at projecting, analysis, and documenting of information system. It involves 6 main stages: analysis of existing system or estimation of practicability, requirements definition, determination of technical requirements and equipment cost, development of logical data model, projecting of logical requirements and specification them, physical projecting. Each of them is also divided into several steps defining the tasks that should be fulfilled at a given stage. The most important SSADM elements are flows modeling with help of DFD, data logic modeling with help of LDS (Logical Data Structure) and description of entities behavior. Applying of SSADM is easy with ConceptDraw DIAGRAM diagramming and vector drawing software and Data Flow Diagram solution.

data flow diagram, DFD templates Data Flow Diagrams (DFD)

data flow diagram, DFD templates
Data Flow Diagrams solution extends ConceptDraw DIAGRAM software with templates, samples and libraries of vector stencils for drawing the data flow diagrams (DFD).

Data Flow Diagram Examples

Data flow diagrams (DFDs) are effective to reveal relationships among the various components in a program or system. This type of diagrams is an important and useful technique for modeling an information system, its process aspects, for showing a system as a single high-level process. DFD lets illustrate the flow of data, how the input data are transformed to output results across the sequence of functional transformations. DFD consists of four major components: entities, processes, data stores, data flows. When you need to draw a Data Flow Diagram the ConceptDraw DIAGRAM diagramming and vector drawing software extended with Data Flow Diagrams solution will be helpful for you. Providing numerous collection of Data Flow Diagram examples, samples, templates and ready-to-use vector DFD symbols, Data Flow Diagrams solution ensures you with all needed tools for easy designing DFDs according to Gane-Sarson or Yourdon-Coad notation on your choice. Any from offered predesigned DFD examples can become a perfect base for your own diagram.