HelpDesk
How to Connect a Live Object to a Text Data Source


HelpDesk
How to Connect Text Data to a Time Series Chart on Your Live Dashboard


HelpDesk
How to Connect Tabular Data (CSV) to a Graphic Indicator on Your Live Dashboard

The vector stencils library "Data" contains 10 data symbols: data object, collection data object, data input and output, data input and output collections, data store, initiating and non-initiating messages, data association.
Use these shapes for drawing business process diagrams (BPMN 2.0) using the ConceptDraw PRO diagramming and vector drawing software.
"Artifacts allow developers to bring some more information into the model/ diagram. In this way the model/ diagram becomes more readable. There are three pre-defined Artifacts and they are:
(1) Data objects: Data objects show the reader which data is required or produced in an activity.
(2) Group: A Group is represented with a rounded-corner rectangle and dashed lines. The group is used to group different activities but does not affect the flow in the diagram.
(3) Annotation: An annotation is used to give the reader of the model/ diagram an understandable impression." [Business Process Model and Notation. Wikipedia]
The example "Design elements - Data BPMN 2.0" is included in the Business Process Diagram solution from the Business Processes area of ConceptDraw Solution Park.
BPMN 2.0 data symbols
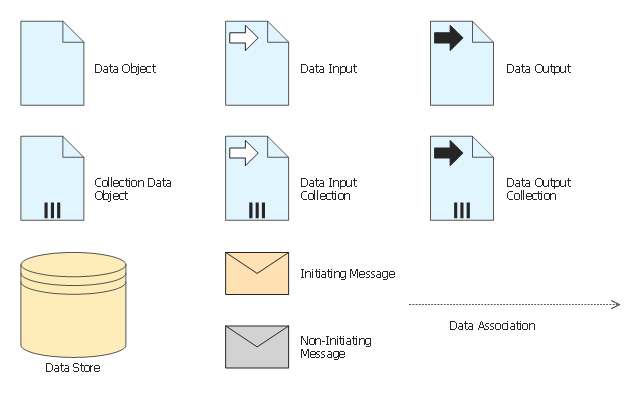
Business Process Elements: Data
")

HelpDesk
How to Use ConceptDraw Sales Dashboard Solution

The vector stencils library "Artifacts BPMN 1.2" contains 3 artifact shapes.
Use it for drawing business process diagrams (BPMN 1.2) in the ConceptDraw PRO diagramming and vector drawing software extended with the Business Process Diagram solution from the Business Processes area of ConceptDraw Solution Park.
www.conceptdraw.com/ solution-park/ business-process-diagram
Use it for drawing business process diagrams (BPMN 1.2) in the ConceptDraw PRO diagramming and vector drawing software extended with the Business Process Diagram solution from the Business Processes area of ConceptDraw Solution Park.
www.conceptdraw.com/ solution-park/ business-process-diagram
Text annotation
Group

Data object

HelpDesk
How to Create Data-driven Infographics

HelpDesk
How to Work with Custom Properties in ConceptDraw PRO on PC

Diagramming Software for Business Process
")
HelpDesk
How to Make Business Intelligence Dashboard

- Bpmn 2 0 Data Symbols
- How to Connect a Live Object to a Text Data Source | How to ...
- Coad/Yourdon's Object -Oriented Analysis model | Data Flow ...
- Data Flow Diagram Symbols. DFD Library | Coad/Yourdon's Object ...
- Data Flow Diagram Examples | Types of Flowcharts | IDEF4 ...
- Data Object In Bpmn
- Bpmn Data Object Beispiele
- Object Flow Diagram
- Coad/Yourdon's Object -Oriented Analysis model | Data Flow ...
- Accounting Flowchart Symbols | Process Flow Diagram | Data Flow ...
- How to Connect a Live Object to a Text Data Source | Data Flow ...
- Yourdon and Coad Diagram | Coad/Yourdon's Object -Oriented ...
- Design elements - Data BPMN 2.0 | Business Process Diagrams ...
- Bpmn Data Object Pool
- Data object
- Data Flow Diagrams | Diagramming Software for Design UML Object ...
- Data Flow Diagram For Object Tracking
- Coad/Yourdon's Object -Oriented Analysis model | Yourdon and ...
- How to Connect a Live Object to a CSV Data Source | How to ...