 Status Dashboard
Status dashboard solution extends ConceptDraw PRO software with templates, samples and vector stencils libraries with graphic indicators for drawing the visual dashboards showing status data.
 Comparison Dashboard
Comparison dashboard solution extends ConceptDraw PRO software with samples, templates and vector stencils library with charts and indicators for drawing the visual dashboard comparing data.
 Sales Dashboard
Sales Dashboard solution extends ConceptDraw PRO software with templates, samples and library of vector stencils for drawing the visual dashboards of sale metrics and key performance indicators (KPI).
 Meter Dashboard
Meter dashboard solution extends ConceptDraw PRO software with templates, samples and vector stencils library with meter indicators for drawing visual dashboards showing quantitative data.
 Spatial Dashboard
Spatial dashboard solution extends ConceptDraw PRO software with templates, samples and vector stencils libraries with thematic maps for drawing visual dashboards showing spatial data.
HelpDesk
How to Create Project Dashboard on Mac

 Time Series Dashboard
Time series dashboard solution extends ConceptDraw PRO software with templates, samples and vector stencils libraries with charts, graphs and plots for drawing the visual dashboards showing data time series.
 Frequency Distribution Dashboard
Frequency distribution dashboard solution extends ConceptDraw PRO software with samples, templates and vector stencils libraries with histograms and area charts for drawing the visual dashboards showing frequency distribution of data.
HelpDesk
How to Use ConceptDraw Sales Dashboard Solution


 Composition Dashboard
Composition dashboard solution extends ConceptDraw PRO software with templates, samples and vector stencils library with charts and indicators for drawing visual dashboards showing data composition.
HelpDesk
How to Create a Sales Dashboard Using ConceptDraw PRO

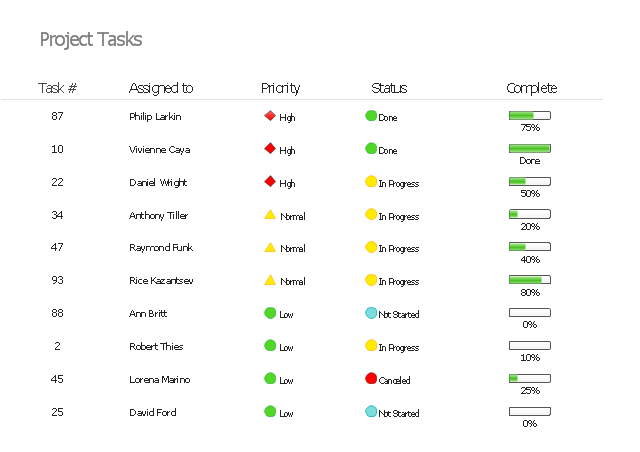
"In project management, a task is an activity that needs to be accomplished within a defined period of time or by a deadline. A task can be broken down into assignments which should also have a defined start and end date or a deadline for completion. One or more assignments on a task puts the task under execution. Completion of all assignments on a specific task normally renders the task completed. Tasks can be linked together to create dependencies." [Task (project management). Wikipedia]
The example "Project task status dashboard" was created using the ConceptDraw PRO diagramming and vector drawing software extended with the Status Dashboard solution from the area "What is a Dashboard" of ConceptDraw Solution Park.
The example "Project task status dashboard" was created using the ConceptDraw PRO diagramming and vector drawing software extended with the Status Dashboard solution from the area "What is a Dashboard" of ConceptDraw Solution Park.
Status dashboard
 ConceptDraw Dashboard for Facebook
ConceptDraw Dashboard for Facebook solution extends ConceptDraw PRO software with a dynamically updated visual dashboard, which shows lifetime total likes, daily friends of fans, and daily page views, information you can receive from Facebook Insights.
Sales Dashboard - insight about potential opportunities and key sales operations

 PM Dashboards
This solution extends ConceptDraw PRO and ConceptDraw PROJECT software with the ability to clearly display the identified key performance indicators for any project.
- PM Dashboards | Project management task status dashboard | How ...
- Kpi Dashboard Examples
- Status Dashboard | PM Dashboards | How to Create Project ...
- Ms Project Dashboard Report
- Maintenance Dashboard Examples
- PM Dashboards | Status Dashboard | Project management task ...
- Sales KPI Dashboards | The Facts and KPIs | A KPI Dashboard ...
- Reporting Dashboard Software for Business | Dashboard Software ...
- How to Create Project Dashboard on Mac | Pie Charts | Cross ...
- Safety Dashboard Template
- Sales Dashboard | Sales Process Flowchart. Flowchart Examples ...
- PM Dashboards | Meter Dashboard | Enterprise dashboard | Quality ...
- Sales Dashboard Template | Sales KPI Dashboards | Visualize ...
- PM Dashboards | Status Dashboard | How to Create Project ...
- Support calls by products - Business dashboard | Reporting ...
- HR dashboard | Enterprise dashboard | HR Flowcharts | Human ...
- Status Dashboard | PM Teams | PM Agile | Project Status Dashboard ...
- PM Dashboards | KPI Dashboard | How to Create Project ...
- Sales Dashboards for Your Company | Frequency Distribution ...
- Spatial Dashboard | Europe spatial dashboard - Template | Spatial ...