Venn Diagram Examples for Problem Solving. Computer Science. Chomsky Hierarchy
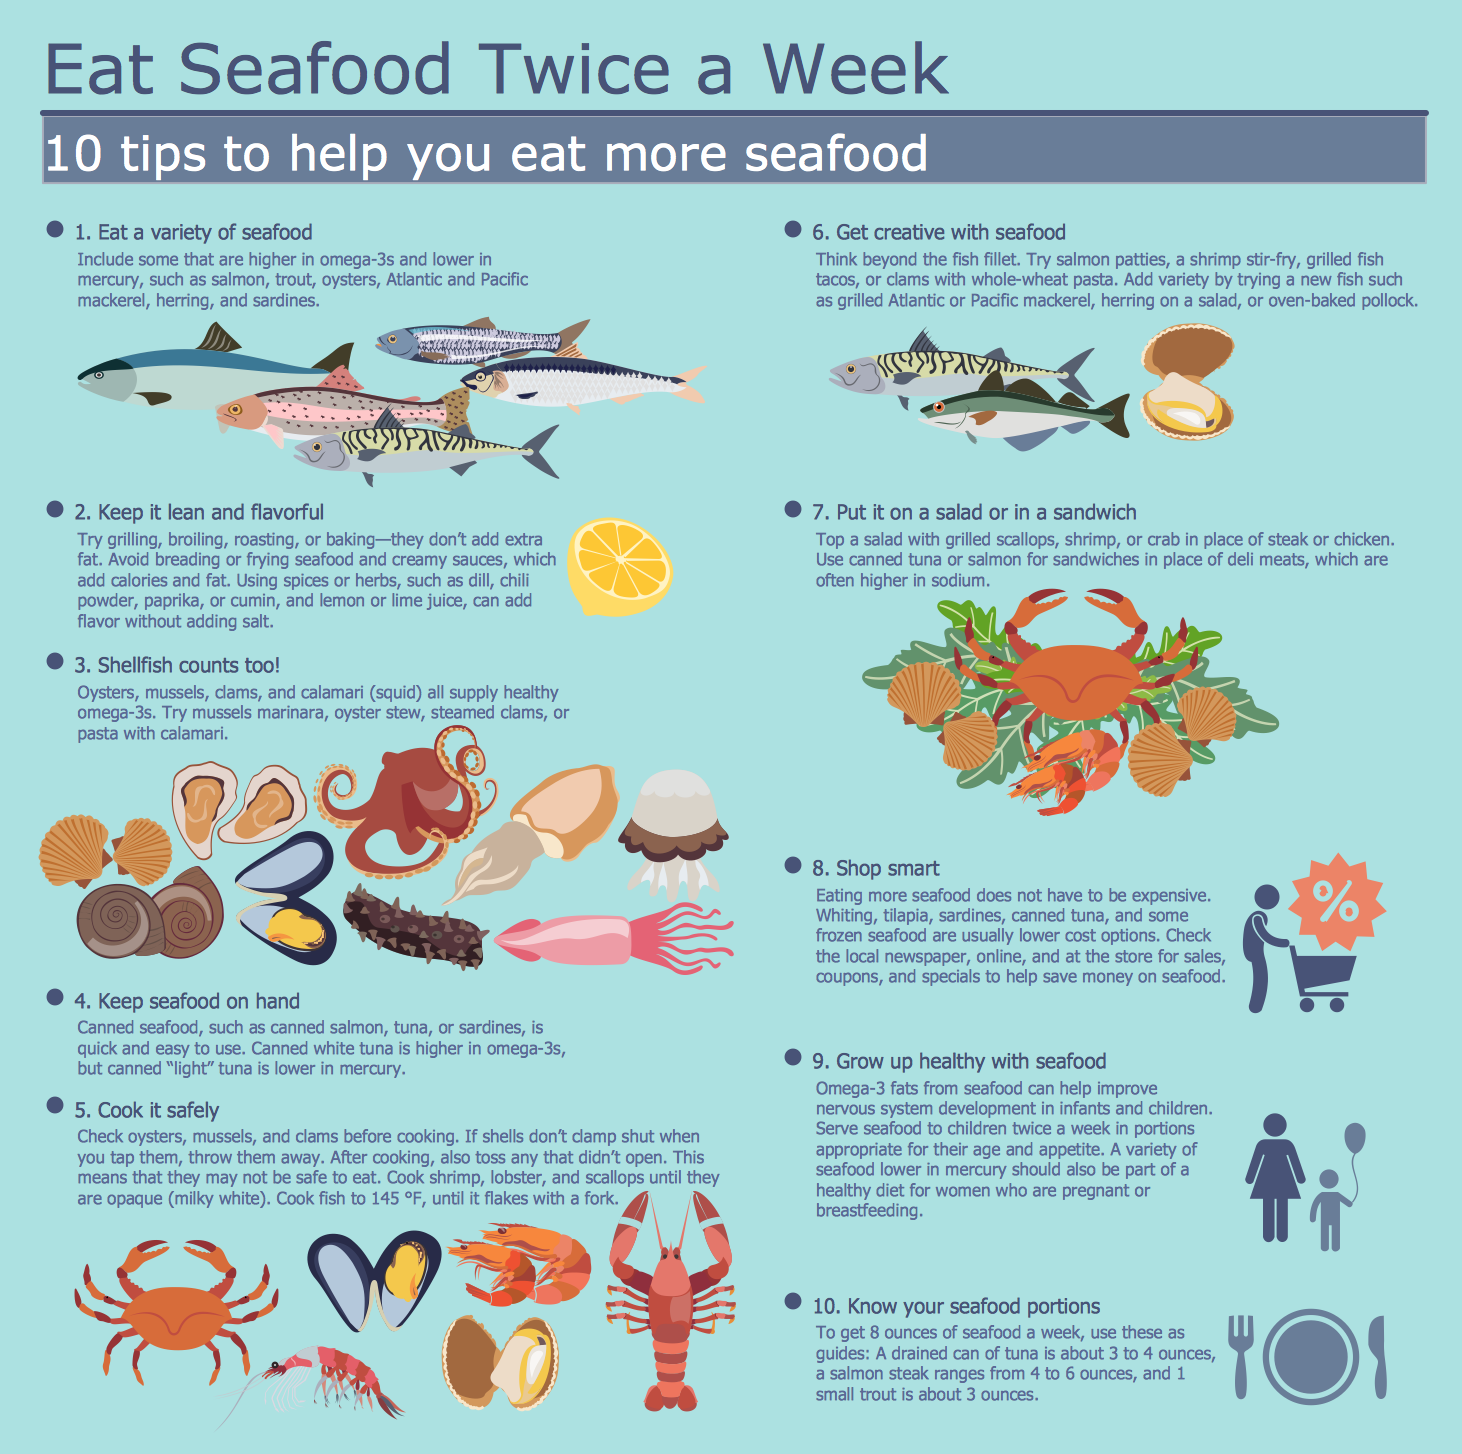
A Venn diagram, sometimes referred to as a set diagram, is a diagramming style used to show all the possible logical relations between a finite amount of sets. In mathematical terms, a set is a collection of distinct objects gathered together into a group, which can then itself be termed as a single object. Venn diagrams represent these objects on a page as circles or ellipses, and their placement in relation to each other describes the relationships between them.The Venn diagram example below visualizes the the class of language inclusions described by the Chomsky hierarchy.
Health Food
The Health Food solution contains the set of professionally designed samples and large collection of vector graphic libraries of healthy foods symbols of fruits, vegetables, herbs, nuts, beans, seafood, meat, dairy foods, drinks, which give powerful possi
Healthy Foods
Use of various charts, diagrams and infographics is the most effective way of visual presenting information about healthy foods, healthy eating and healthy diet. ConceptDraw DIAGRAM diagramming and vector drawing software offers the Health Food solution from the Food and Beverage area of ConceptDraw Solution Park which is overfull of powerful drawing tools, libraries with ready-to-use vector objects and clipart, predesigned samples and examples which will help you easy design healthy foods illustrations.Healthy Food Recipes
A healthy lifestyle and a balanced healthy diet are the basis of health, longevity and good feeling. Every day a human must receive with a food the correct proportions of nutrients and vitamins. It is very important to make a proper menu that includes tasty and healthy dishes.ConceptDraw DIAGRAM diagramming and vector drawing software enhanced with Health Food solution from the Food and Beverage area of ConceptDraw Solution Park will help you easy develop, depict and appetizingly illustrate your healthy food recipes.
Program Evaluation and Review Technique (PERT) with ConceptDraw DIAGRAM
PERT Diagram is a more realistic approach of a project's time estimate analysis. After PERT chart was constructed user can discover the shortest possible duration for entire project timescale. The project timeline is the longest chain that might be taken with connected tasks on the PERT Diagram. Completion of serial tasks need to be accomplished in a presented order. At a project timeline can be independent tasks that not linked with main sequence they are called parallel tasks. PERT diagram is more suitable for Critical Path Analysis than Gantt chart for the reason that it undoubtedly better determine task dependencies. Project managers customarily utilize both methodologies.Competitor Analysis
Competitor analysis is a first and obligatory step in elaboration the proper corporate marketing strategy and creating sustainable competitive advantage. Use powerful opportunities of numerous solutions from ConceptDraw Solution Park for designing illustrative diagrams, charts, matrices which are necessary for effective competitor analysis.Swot Analysis Examples
SWOT Analysis solution from ConceptDraw Solution Park extends ConceptDraw DIAGRAM software with SWOT and TOWS matrix diagram examples and templates, that help identify and analyze Strengths, Weaknesses, Opportunities, and Threats.Chart Examples
Easy charting software comes with beautiful chart templates and examples. This makes it easy to create professional charts without prior experience.Bar Chart Examples
Complete set of bar chart examples is produced using ConceptDraw software. Surfing bar chart examples you can find an example that is the best for your case.Infographic Examples
Never before creation of management infographics wasn’t so easy as now thanks to the Management Infographics Solution from the Business Infographics Area for ConceptDraw Solution Park. This solution offers extensive drawing tools and also unique collection of professionally designed infographic examples.- Healthy Food Recipes | Health Food | Healthy Foods | Dairy Examples
- Flow chart Example . Warehouse Flowchart | Dairy Industry Plant ...
- Example Of Dairy Product
- Flow chart Example . Warehouse Flowchart | Food Court | Geo Map ...
- Dairy Management System Project Diagram
- Draw An ER Diagram For Dairy Milk Production
- Dairy Project
- Example of DFD for Online Store (Data Flow Diagram) DFD ...
- Health Food | Online Shopping For Calendar And Diary Project Data ...
- Fishbone Diagram | Fishbone Diagrams | Health Food | Example Of ...
- ERD | Entity Relationship Diagrams, ERD Software for Mac and Win
- Flowchart | Basic Flowchart Symbols and Meaning
- Flowchart | Flowchart Design - Symbols, Shapes, Stencils and Icons
- Flowchart | Flow Chart Symbols
- Electrical | Electrical Drawing - Wiring and Circuits Schematics
- Flowchart | Common Flowchart Symbols