Venn Diagram Examples for Problem Solving. Environmental Social Science. Human Sustainability Confluence

HelpDesk
How to Connect Objects on PC

HelpDesk
How to Add and Edit Connector Text

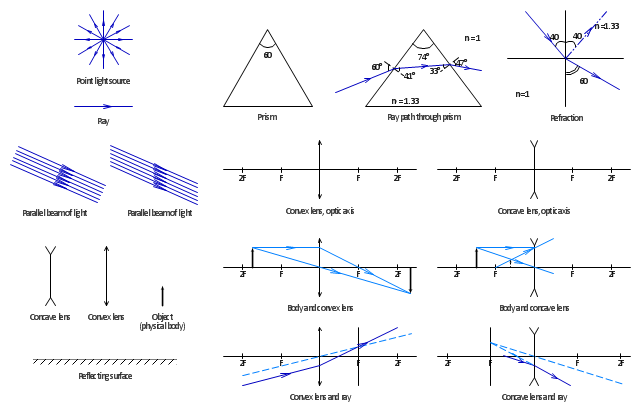
The vector stencils library "Optics" contains 17 symbol icons: reflecting surface; convex and concave lens with and without optic axis, body or ray; ray; parallel beam of light; point light source; prism with and without ray path; refraction.
Use these shapes for drawing schemes of physical experiments in geometrical optics and ray tracing diagrams.
"Geometrical optics, or ray optics, describes light propagation in terms of "rays". The "ray" in geometric optics is an abstraction, or "instrument", which can be used to approximately model how light will propagate. Light rays are defined to propagate in a rectilinear path as they travel in a homogeneous medium. Rays bend (and may split in two) at the interface between two dissimilar media, may curve in a medium where the refractive index changes, and may be absorbed and reflected. Geometrical optics provides rules, which may depend on the color (wavelength) of the ray, for propagating these rays through an optical system. This is a significant simplification of optics that fails to account for optical effects such as diffraction and interference. It is an excellent approximation, however, when the wavelength is very small compared with the size of structures with which the light interacts. Geometric optics can be used to describe the geometrical aspects of imaging, including optical aberrations." [Geometrical optics. Wikipedia]
The example "Design elements - Optics" was created using the ConceptDraw PRO diagramming and vector drawing software extended with the Physics solution from the Science and Education area of ConceptDraw Solution Park.
Optical symbols
Venn Diagram Examples for Problem Solving. Computer Science. Chomsky Hierarchy

The vector stencils library "Plane geometry" contains 27 plane geometric figures.
Use these shapes to draw your geometrical diagrams and illustrations in the ConceptDraw PRO diagramming and vector drawing software extended with the Mathematics solution from the Science and Education area of ConceptDraw Solution Park.
Use these shapes to draw your geometrical diagrams and illustrations in the ConceptDraw PRO diagramming and vector drawing software extended with the Mathematics solution from the Science and Education area of ConceptDraw Solution Park.
Circular sector
Right triangle
Rectangle
Square
Pentagon
Isosceles trapezium
Parallelogram
Trapezium
Three-pointed star

Four-pointed star

Five-pointed star

Six-pointed star

Seven-pointed star

Eight-pointed star

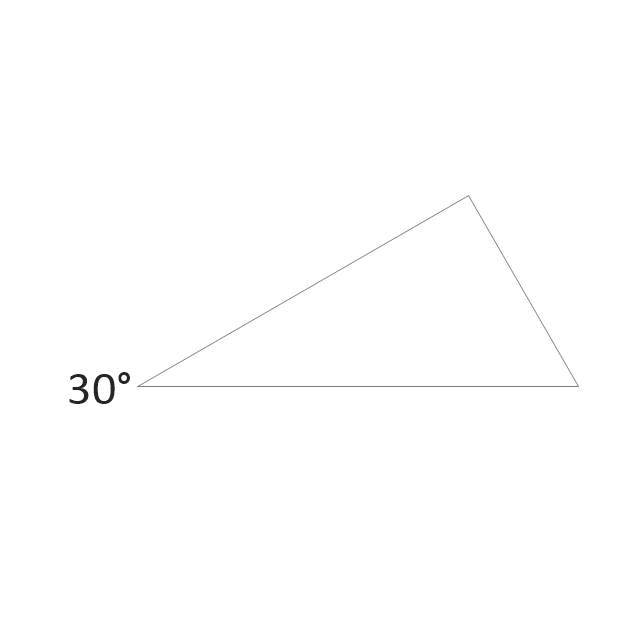
Triangle
Equilateral triangle
Right triangle 2
Right triangle, angle box
Right triangle 3
Hexagon
Regular hexagon
Regular pentagon
Regular heptagon
Regular octagon
Rhombus

Circle

Ellipse
The vector stencils library Registers, drills and diffusers contains 47 symbols of rectangular, circular, linear and troffer air handling inlet/ outlet components.
Use the design elements library Registers, drills and diffusers to draw reflected ceiling plans (RCP) and HVAC layout floor plans using the ConceptDraw PRO diagramming and vector drawing software.
"A ceiling is an overhead interior surface that covers the upper limit of a room. It is not generally considered a structural element, but a finished surface concealing the underside of the floor or roof structure above.
Ceilings are classified according to their appearance or construction. A cathedral ceiling is any tall ceiling area similar to those in a church. A dropped ceiling is one in which the finished surface is constructed anywhere from a few inches to several feet below the structure above it. This may be done for aesthetic purposes, such as achieving a desirable ceiling height; or practical purposes such as providing a space for HVAC or piping. An inverse of this would be a raised floor. A concave or barrel shaped ceiling is curved or rounded, usually for visual or acoustical value, while a coffered ceiling is divided into a grid of recessed square or octagonal panels, also called a "lacunar ceiling". A cove ceiling uses a curved plaster transition between wall and ceiling; it is named for cove molding, a molding with a concave curve." [Ceiling. Wikipedia]
"... reflected Ceiling Plans (RCP)s showing ceiling layouts appear after the floor plans." [Plan (drawing). Wikipedia]
The shapes library "Registers, drills and diffusers" is contained in the Reflected Ceiling Plans solution from the Building Plans area of ConceptDraw Solution Park.
Reflected ceiling plan symbols

The vector stencils library "Plane geometry" contains 27 plane geometric figures.
Use these shapes to draw your geometrical diagrams and illustrations in the ConceptDraw PRO diagramming and vector drawing software extended with the Mathematics solution from the Science and Education area of ConceptDraw Solution Park.
Use these shapes to draw your geometrical diagrams and illustrations in the ConceptDraw PRO diagramming and vector drawing software extended with the Mathematics solution from the Science and Education area of ConceptDraw Solution Park.
Circular sector
Right triangle
Rectangle
Square
Pentagon
Isosceles trapezium
Parallelogram
Trapezium
Three-pointed star
Four-pointed star
Five-pointed star
Six-pointed star
Seven-pointed star
Eight-pointed star
Triangle
Equilateral triangle
Right triangle 2
Right triangle, angle box
Right triangle 3
Hexagon
Regular hexagon
Regular pentagon
Regular heptagon
Regular octagon
Rhombus
Circle
Ellipse
 Frequency Distribution Dashboard
Frequency distribution dashboard solution extends ConceptDraw DIAGRAM software with samples, templates and vector stencils libraries with histograms and area charts for drawing the visual dashboards showing frequency distribution of data.
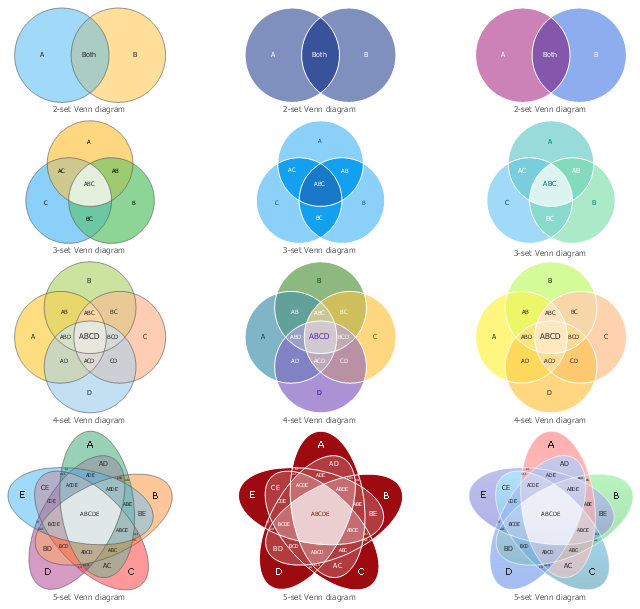
The vector stencils library "Venn diagrams" contains 12 templates. Use it for drawing Venn and Euler diagrams.
"A Venn diagram (also called a set diagram or logic diagram) is a diagram that shows all possible logical relations between a finite collection of different sets. Typically overlapping shapes, usually circles, are used, and an area-proportional or scaled Venn diagram is one in which the area of the shape is proportional to the number of elements it contains. These diagrams represent elements as points in the plane, and sets as regions inside curves. An element is in a set S just in case the corresponding point is in the region for S. They are thus a special case of Euler diagrams, which do not necessarily show all relations. Venn diagrams were conceived around 1880 by John Venn. They are used to teach elementary set theory, as well as illustrate simple set relationships in probability, logic, statistics, linguistics and computer science." [Venn diagram. Wikipedia]
The templates example "Design elements - Venn diagrams" was created using the ConceptDraw PRO diagramming and vector drawing software extended with the Venn Diagrams solution from the area "What is a Diagram" of ConceptDraw Solution Park.
Venn diagram templates