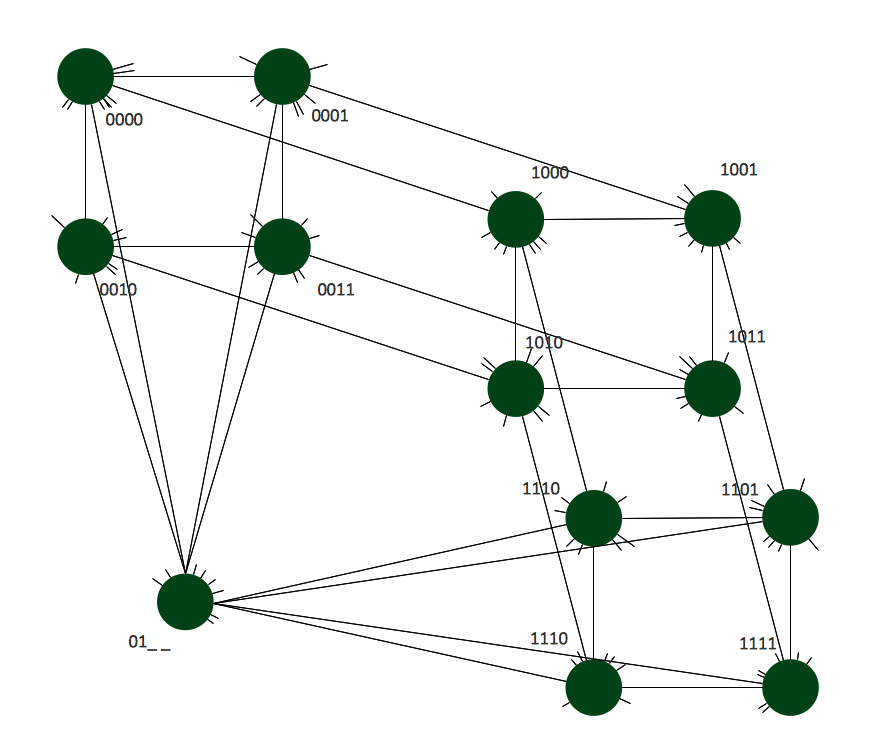
Hypercube Network Topology
Stakeholder Mapping Tool

HelpDesk
How To Make a Crow's Foot ER Diagram

Line Chart Template for Word

Flow chart Example. Warehouse Flowchart


Basic Flowchart Symbols and Meaning


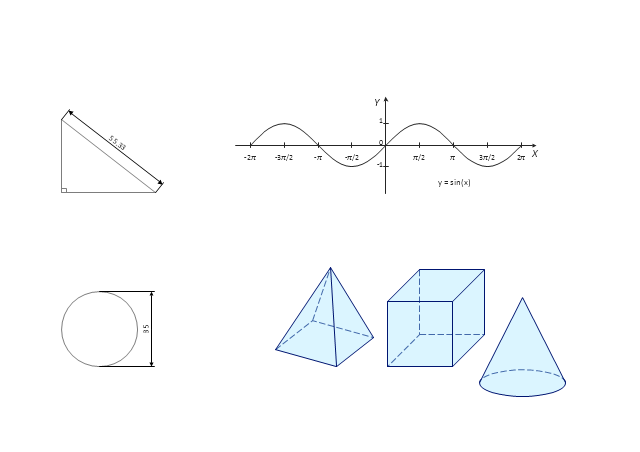
Use this mathematical drawings and graphs template to create your own math illustrations using the shapes of plane and solid geometric figures as well as trigonometric functions.
"Mathematical visualization or mathematical visualization is an aspect of geometry which allows one to understand and explore mathematical phenomena via visualization. Classically this consisted of two-dimensional drawings or building three-dimensional models (particularly plaster models in the 19th and early 20th century), while today it most frequently consists of using computers to make static two or three dimensional drawings, animations, or interactive programs. Writing programs to visualize mathematics is an aspect of computational geometry." [Mathematical visualization. Wikipedia]
The math illustrations template for the ConceptDraw PRO diagramming and vector drawing software is included in the Mathematics solution from the Science and Education area of ConceptDraw Solution Park.
Mathematical drawings and graphs
 IDEF Business Process Diagrams
Use the IDEF Business Process Diagrams solution to create effective database designs and object-oriented designs, following the integration definition methodology.
 AWS Architecture Diagrams
AWS Architecture Diagrams with powerful drawing tools and numerous predesigned Amazon icons and AWS simple icons is the best for creation the AWS Architecture Diagrams, describing the use of Amazon Web Services or Amazon Cloud Services, their application for development and implementation the systems running on the AWS infrastructure. The multifarious samples give you the good understanding of AWS platform, its structure, services, resources and features, wide opportunities, advantages and benefits from their use; solution’s templates are essential and helpful when designing, description and implementing the AWS infrastructure-based systems. Use them in technical documentation, advertising and marketing materials, in specifications, presentation slides, whitepapers, datasheets, posters, etc.
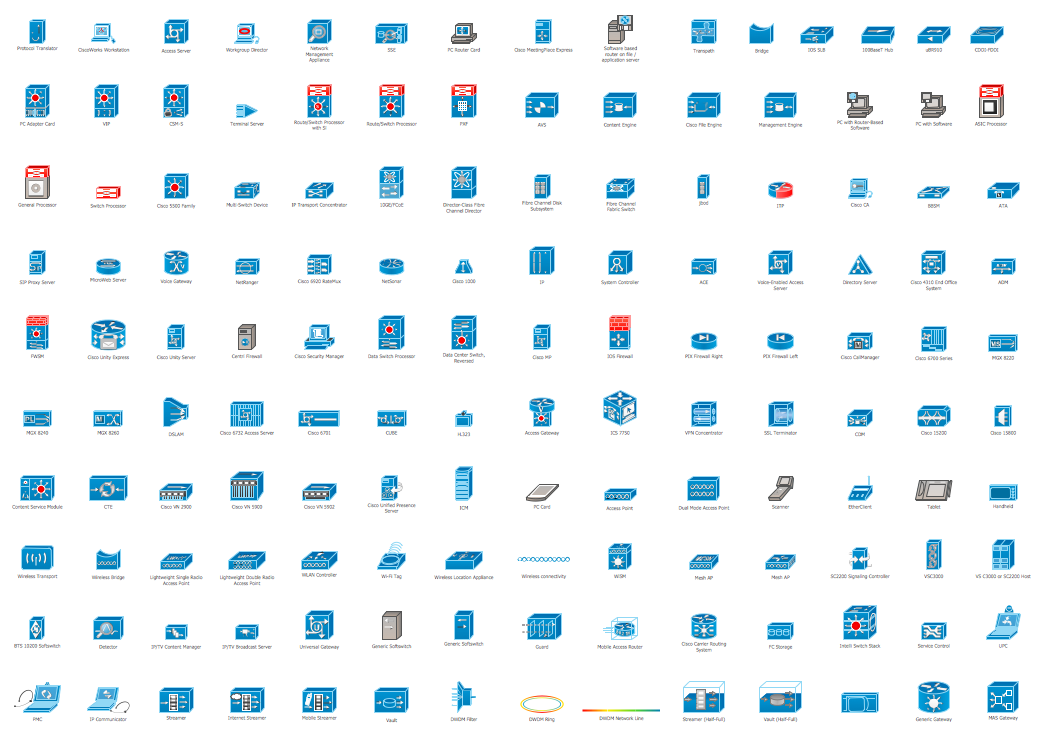
Cisco Products Additional. Cisco icons, shapes, stencils and symbols
- Triangular Venn diagram - Template | Pyramid diagrams - Vector ...
- Entity-Relationship Diagram (ERD) | Er Diagram For Shop ...
- Circular Arrows | Circular Arrow | Circular Flow Diagram Template ...
- Arrow circle chart - Template | How to Draw a Circular Arrows ...
- Mathematical Diagrams | Mathematics Symbols | Math illustrations ...
- Math illustrations - Template | 3 Circle Venn Diagram . Venn Diagram ...
- Polyhedron Pyramid
- Office furniture - Vector stencils library | Databases Access Objects ...
- Porter's value chain diagram
- Spider Chart Template | Cloud clipart - Vector stencils library ...