 Entity-Relationship Diagram (ERD)
Entity-Relationship Diagram (ERD) solution extends ConceptDraw PRO software with templates, samples and libraries of vector stencils from drawing the ER-diagrams by Chen's and crow’s foot notations.
 Entity-Relationship Diagram (ERD)
An Entity-Relationship Diagram (ERD) is a visual presentation of entities and relationships. That type of diagrams is often used in the semi-structured or unstructured data in databases and information systems. At first glance ERD is similar to a flowch
HelpDesk
How to Create an ERD Diagram
ERD (entity relationship diagram) is used to show the logical structure of databases. It represents the interrelationships between components of database (entities). Entity relationship diagrams are a widely used in software engineering. Using ERD software engineers can control the every aspect of database development. ER diagram can be used as guide for testing and communicating before the release of software product. ERD displays data as entities that are connected with connections that show the relationships between entities. There is some ERD notations used by data bases developers for representing the relationships between the data objects. ConceptDraw PRO and its ERD solution allow you to build ERD diagram of any notation.Data modeling with ConceptDraw PRO
Data modelling will help you to study and analyze business processes in your organization for optimization and increase of effectiveness and production.HelpDesk
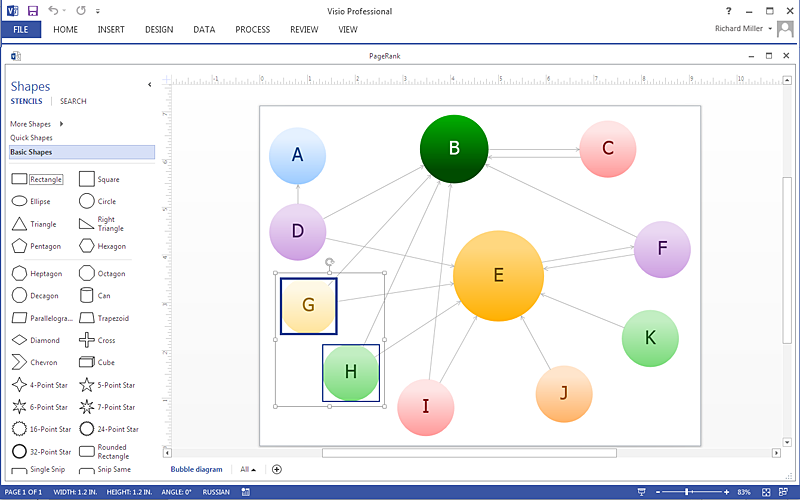
How to Add a Bubble Diagram to a MS Word Document Using ConceptDraw PRO
A bubble chart is a diagram in which the data points are replaced with bubbles, and the size of the bubbles represents some additional dimension of the data. A bubble chart does not have the axis. A bubble chart can be used instead of a scatter diagram if the data has three dimensions, each of that containing the set of values. The sizes of the bubbles are determined by the values in the third dimension. Any additional information about the entities beyond their three primary dimensions can be depicted by rendering bubbles in colors and patterns that are selected in a certain way. The legend containing the further information can be added to a bubble diagram. ConceptDraw PRO allows you to easily create various business management and marketing charts, including bubble diagrams and then add them to a MS Word document.HelpDesk
How To Create a Visio Bubble Chart Using ConceptDraw PRO
ConceptDraw PRO allows you to easily create business charts and diagrams of any complexity, including the bubbles diagram and then make a MS Visio file from your diagram in a few simple steps.HelpDesk
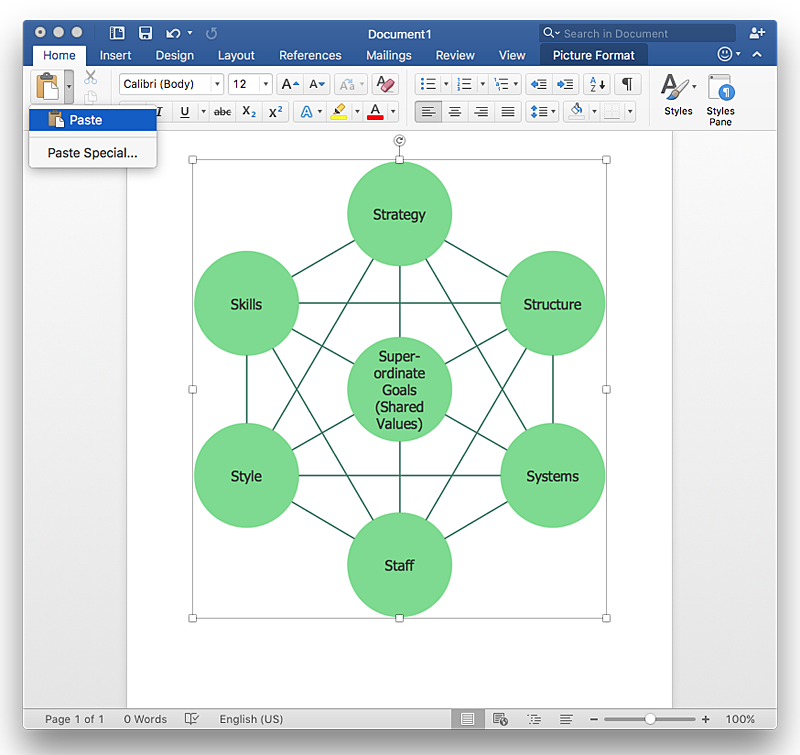
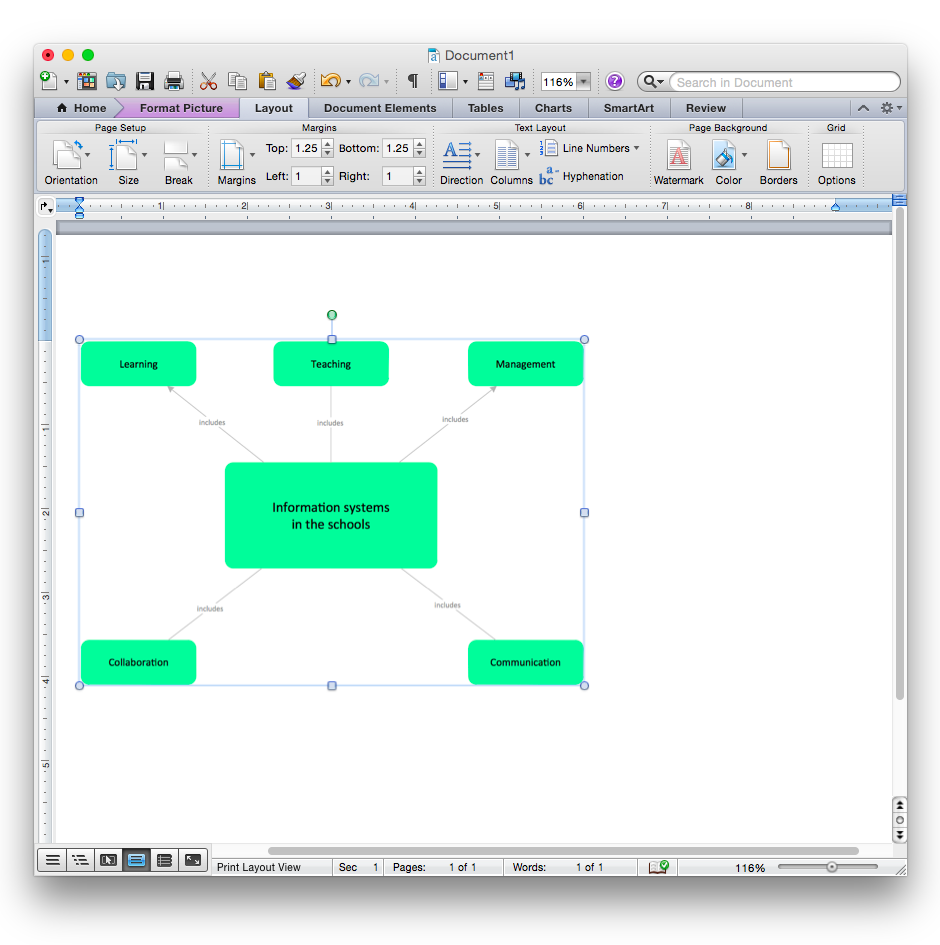
How to Add a Concept Map to a MS Word Document Using ConceptDraw PRO
ConceptDraw PRO allows you to easily create concept maps and then insert them into a MS Word document.- Entity Relationship Diagram Software for Design Crows Foot ER ...
- Design elements - ER diagram (Chen notation) | Entity Relationship ...
- Design Element: Crows Foot for Entity Relationship Diagram - ERD ...
- Entity Relationship Diagram Symbols and Meaning ERD Symbols ...
- Data Flow Diagrams | Entity Relationship Diagram Examples | Entity ...
- Entity Relationship Diagram Symbols and Meaning ERD Symbols ...
- Entity Relationship Diagram Symbols and Meaning ERD Symbols ...
- Contoh Erd Crows Foot
- Design elements - ERD (crow's foot notation) | Entity-relationship ...
- Hotel Management System For Er Diagram Using Crows Foot Notation
- Detailed Entity Relationship Diagram Example For Management
- Entity Relationship Diagram Symbols and Meaning ERD Symbols ...
- Entity-Relationship Diagram ( ERD ) with ConceptDraw PRO | Basic ...
- Entity Relationship Diagram Symbols and Meaning ERD Symbols ...
- Entity-Relationship Diagram ( ERD ) | Process Flowchart ...
- Entity Relationship Diagram Symbols and Meaning ERD Symbols ...
- Entity Relationship Diagram Symbols and Meaning ERD Symbols ...
- Basic Flowchart Symbols and Meaning | Entity Relationship ...
- Entity-Relationship Diagram ( ERD ) | ConceptDraw PRO Database ...
- Entity Relationship Diagram Symbols and Meaning ERD Symbols ...


