 Block Diagrams
Block diagrams solution extends ConceptDraw DIAGRAM software with templates, samples and libraries of vector stencils for drawing the block diagrams.
Express-G Diagram

Sales Process Flowchart. Flowchart Examples

ConceptDraw DIAGRAM - Organizational chart software

The Best Flowchart Software Available


, t chart, decision matrix, decision tree analysis") Decision Making
Decision Making
The Decision Making solution offers the set of professionally developed examples, powerful drawing tools and a wide range of libraries with specific ready-made vector decision icons, decision pictograms, decision flowchart elements, decision tree icons, decision signs arrows, and callouts, allowing the decision maker (even without drawing and design skills) to easily construct Decision diagrams, Business decision maps, Decision flowcharts, Decision trees, Decision matrix, T Chart, Influence diagrams, which are powerful in questions of decision making, holding decision tree analysis and Analytic Hierarchy Process (AHP), visual decomposition the decision problem into hierarchy of easily comprehensible sub-problems and solving them without any efforts.
HelpDesk
How to Draw a Pyramid Diagram

ER Diagram Styles

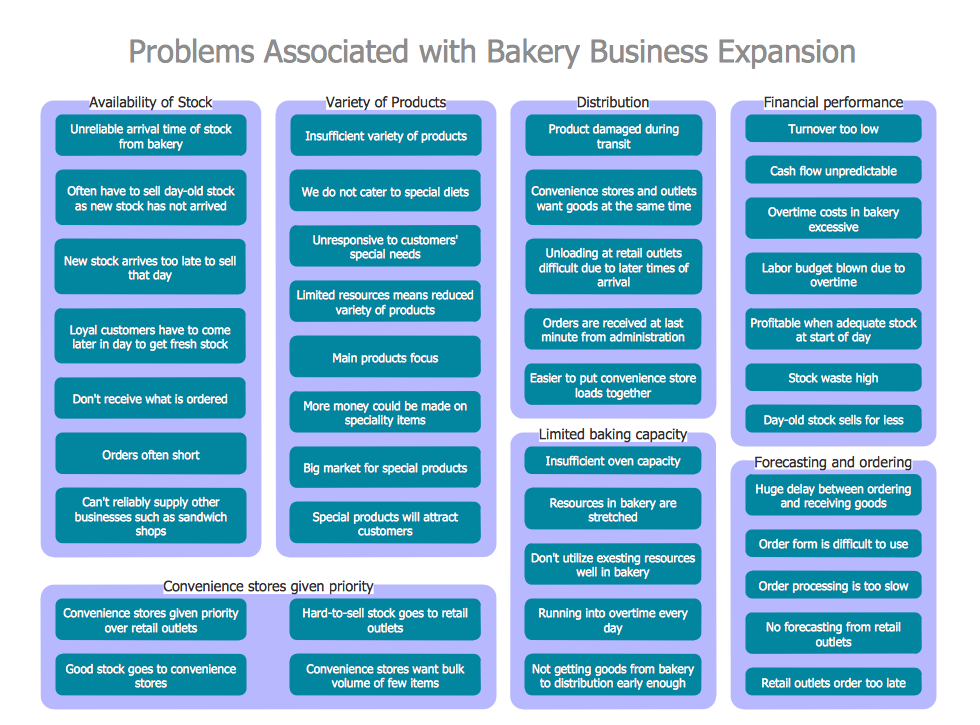
Problem Analysis

 Stakeholder Onion Diagrams
The Stakeholder Onion Diagram is often used as a way to view the relationships of stakeholders to a project goal. A basic Onion Diagram contains a rich information. It shows significance of stakeholders that will have has influence to the success achieve
- Family Relationship In A Flow Chart
- Family Tree Entity Relationship Diagram
- Draw Family Tree Template
- Family Relationship Flowchart
- How To Write A Family Tree Chart
- Create Family Tree Chart Free
- Family Emergency Plan | Express-G Diagram | ER Diagram ...
- What Is Family Tree Chart
- Family Tree Creator
- Free Corporate Tree Template