This site uses cookies. By continuing to browse the ConceptDraw site you are agreeing to our Use of Site Cookies.

Bubble Map Maker

The Bubble Map is a popular tool for visualization a data set which is widely used in economics, medicine, software engineering, architecture, and many other fields. Each bubble on the Bubble Map is characterized by coordinates, color and size. ConceptDraw DIAGRAM diagramming and vector drawing software extended with Bubble Diagrams Solution from the "Diagrams" Area is a powerful Bubble Map Maker.
HelpDesk

How to Create a Bubble Diagram

Bubble Diagram is a simple chart that consists of circles (bubbles) repesening certain topics or processes. Bubbles are connected by lines depicting the type of relationships between the bubbles. The size of each bubble is depended on the importance of the entity it represents. Bubble charts are widely used throughout social, economical, medical, and other scientific researches as well as throughout architecture and business management. Bubble charts are often used during the early stages of product development to visualize thoughts and ideas for the purpose of sketching out a development plan. ConceptDraw DIAGRAM allows you to draw a bubble diagrams using the Bubble Diagrams solution.

Bubble diagrams with ConceptDraw DIAGRAM

Using ConceptDraw you will be able to create bubble diagrams from the ready ConceptDraw library objects or make your own objects. The created diagram can be saved and edited, objects can be moved and links between them will be automatically repainted after object moving because of using the ConceptDraw connectors.
HelpDesk

How To Create Visio Bubble Chart

ConceptDraw DIAGRAM allows you to easily create business charts and diagrams of any complexity, including the bubbles diagram and then make an MS Visio file from your diagram in a few simple steps.

Bubble diagrams in Landscape Design with ConceptDraw DIAGRAM

Creation of a bubble diagrams in ConceptDraw is an easy task as you can use the ready scanned location plan instead of plotting paper and paper location plan. Besides scanning of the ready paper location plan you can easy create it using special ConceptDraw libraries and templates for creation room plans and location plans.

Bubble Charts

Bubble Charts are convenient way to visualize ideas and concepts by organizing them in a hierarchy. To show the importance of ideas you can use different bubble sizes and colors. ConceptDraw DIAGRAM diagramming and vector drawing software extended with Bubble Diagrams Solution from the "Diagrams" Area affords you the easiest and fastest way for designing professional looking Bubble Charts.
HelpDesk

How to Add a Bubble Diagram to PowerPoint Presentation

Bubble diagrams can be used to compare concepts and identify areas of similarity and difference. ConceptDraw DIAGRAM allows you to make an MS PowerPoint Presentation from your charts in a few simple steps. A bubble diagram is a chart that represents information visually in the form of a series of bubbles. Bubble charts are often used in marketing and management during the early stages of product development to visualize ideas and concepts by organizing them in a hierarchy. The ability to create this form of a diagram is contained within the Bubble Diagrams solution. A PowerPoint presentation of bubble diagrams can be used to demonstrate and identify areas of similarity and difference of featured business ideas and concepts.

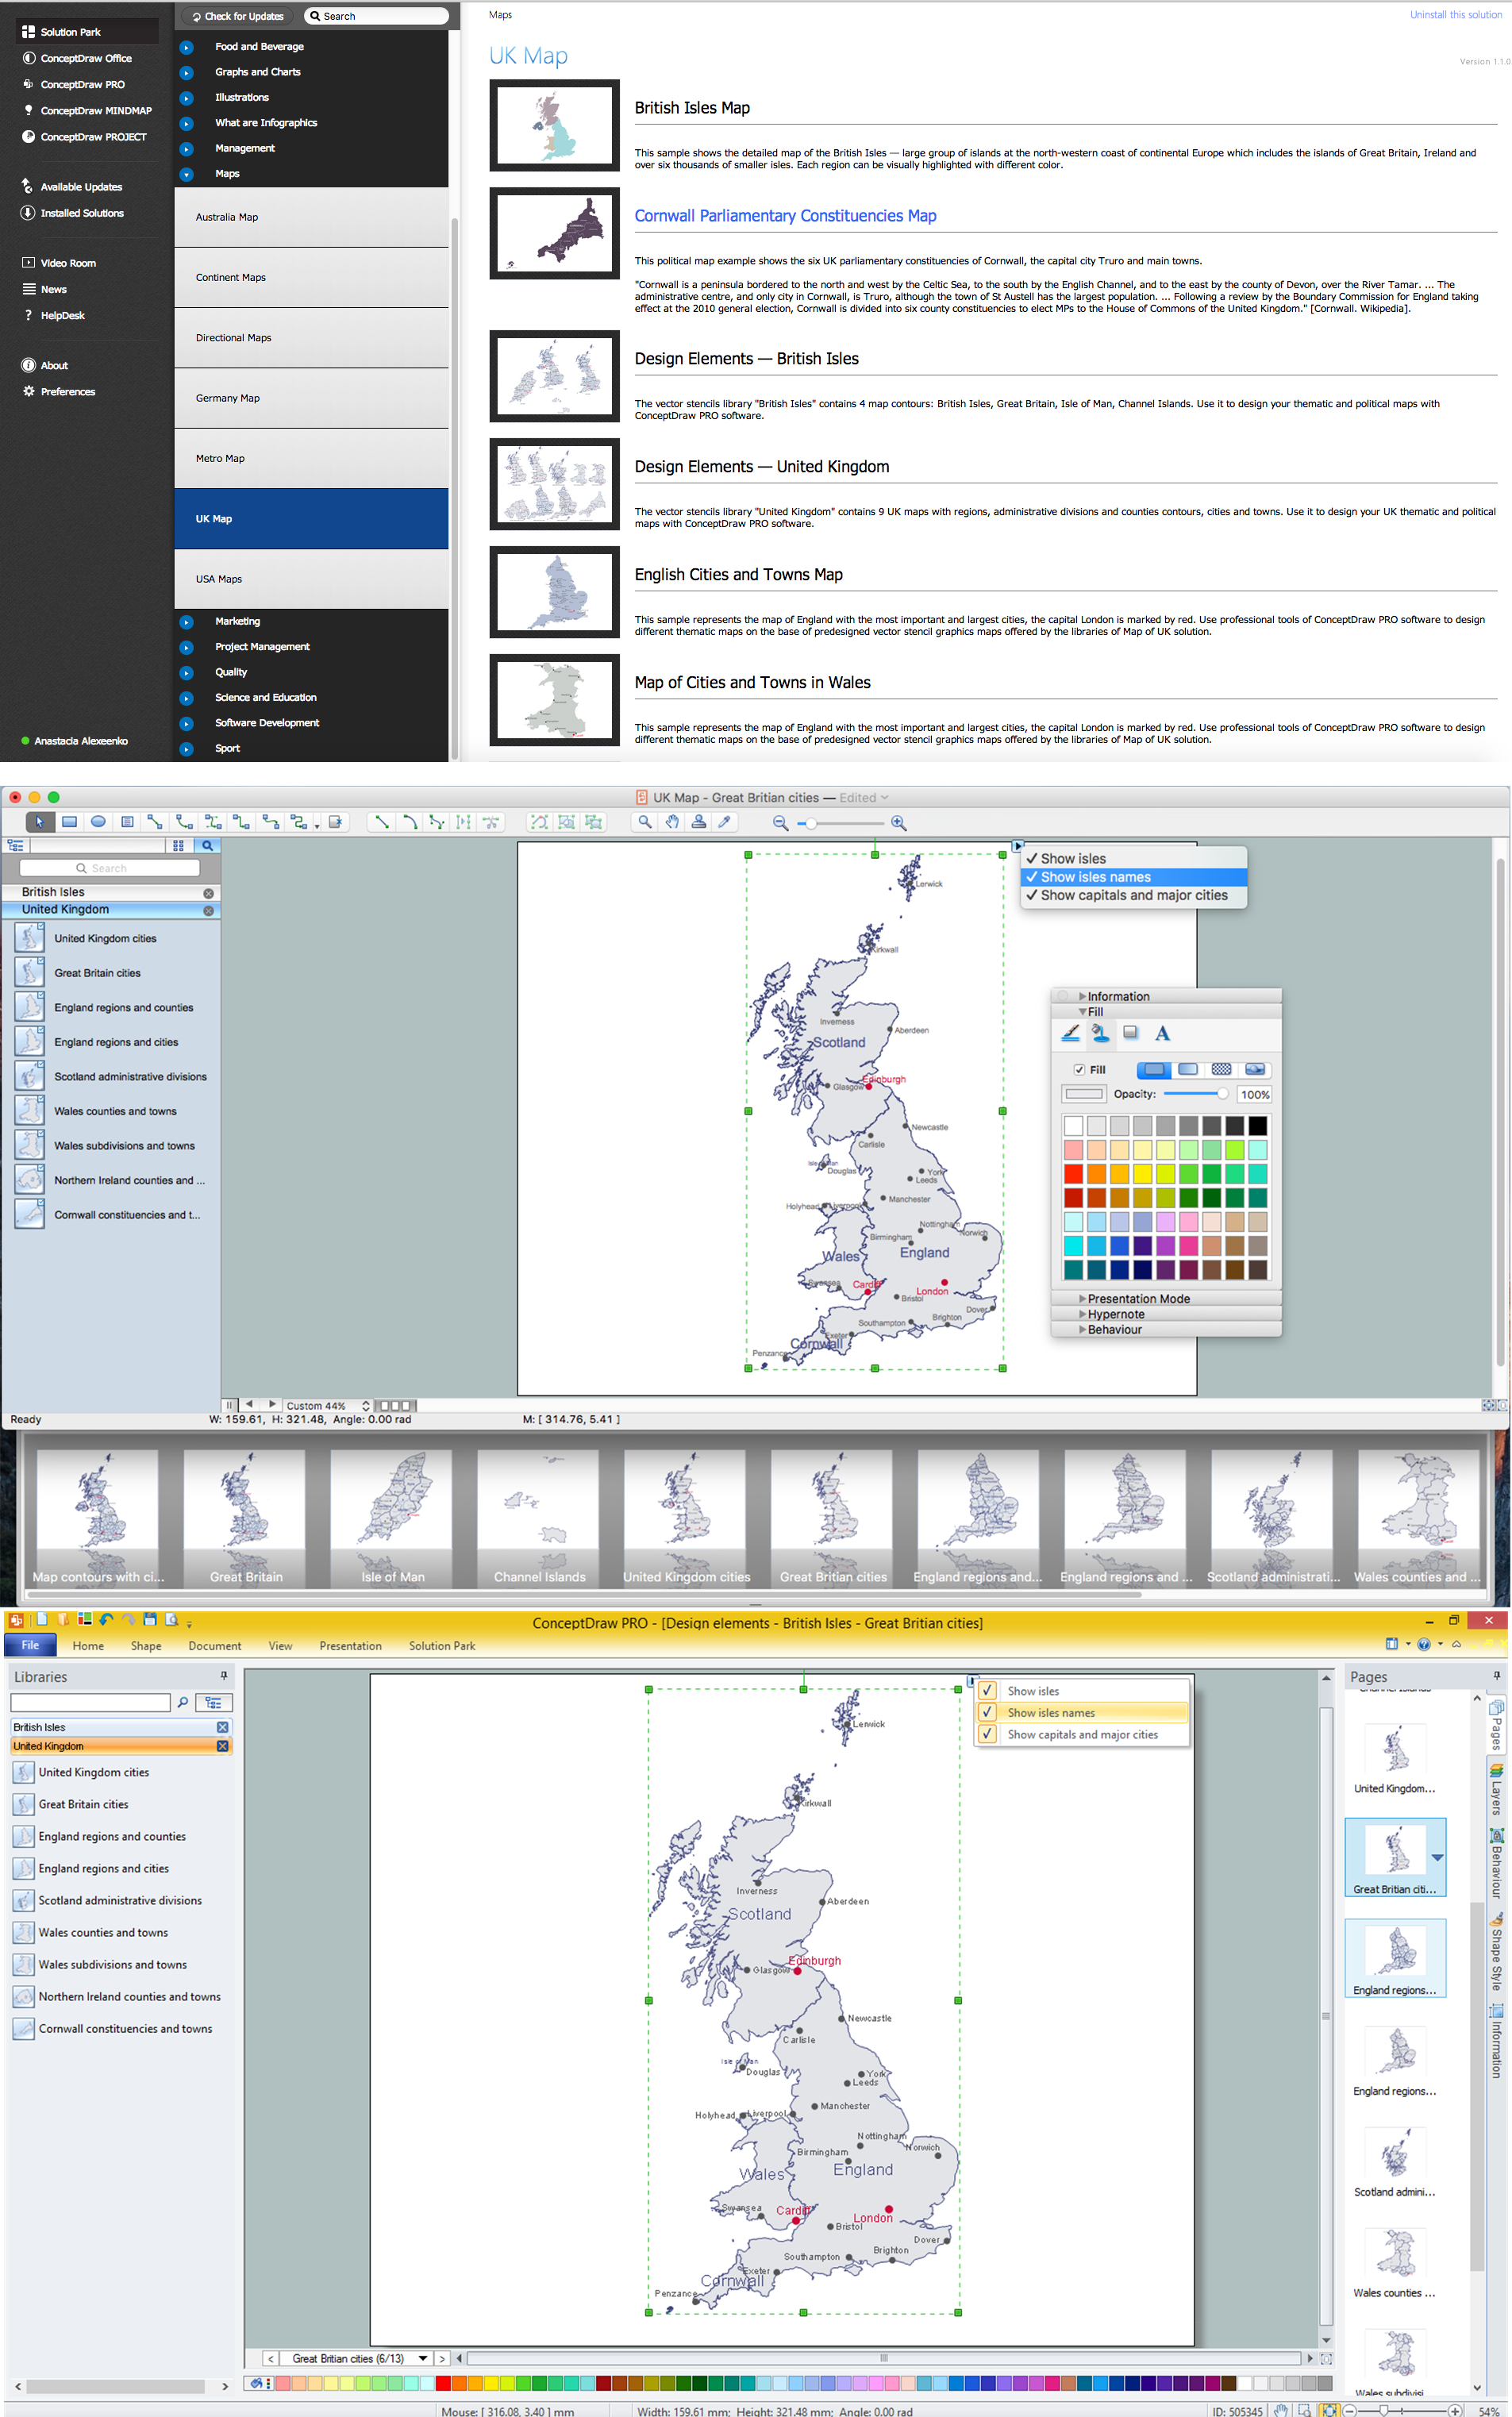
Map of UK — Great Britain Cities

Great Britain, also known as Britain, is an island in the North Atlantic off the north-west coast of continental Europe. With an area of 209,331 km2 (80,823 sq mi), it is the largest island in Europe and the ninth-largest in the world.
How to design the Map of UK fast and easy? It is incredibly convenient to use special software. ConceptDraw DIAGRAM diagramming and vector drawing software offers the Map of UK Solution from the Maps Area of ConceptDraw Solution Park specially developed to make easier drawing the maps of UK counties, various UK related thematic maps and cartograms on their base.

bubble chart, bubble chart creator, bubble diagram Bubble Diagrams

bubble chart, bubble chart creator, bubble diagram
Bubble diagrams have enjoyed great success in software engineering, architecture, economics, medicine, landscape design, scientific and educational process, for ideas organization during brainstorming, for making business illustrations, presentations, planning, design, and strategy development. They are popular because of their simplicity and their powerful visual communication attributes.

How To Make a Bubble Chart

Bubble diagrams solution extends ConceptDraw DIAGRAM software with templates, Using ConceptDraw Connectors, you can make a bubble chart in moments. Using ConceptDraw you will be able to make a bubble chart from the ready ConceptDraw library objects or make your own objects. The created diagram can represent ideas organization, in brainstorming processes, by teachers for explaining difficult ideas or for presentations.