This site uses cookies. By continuing to browse the ConceptDraw site you are agreeing to our Use of Site Cookies.

Prioritization Matrix

You can design the Prioritization Matrix by hand on the paper, but we offer you the most easier way — to use the ConceptDraw DIAGRAM diagramming and vector drawing software extended with Seven Management and Planning Tools Solution from the Management Area.

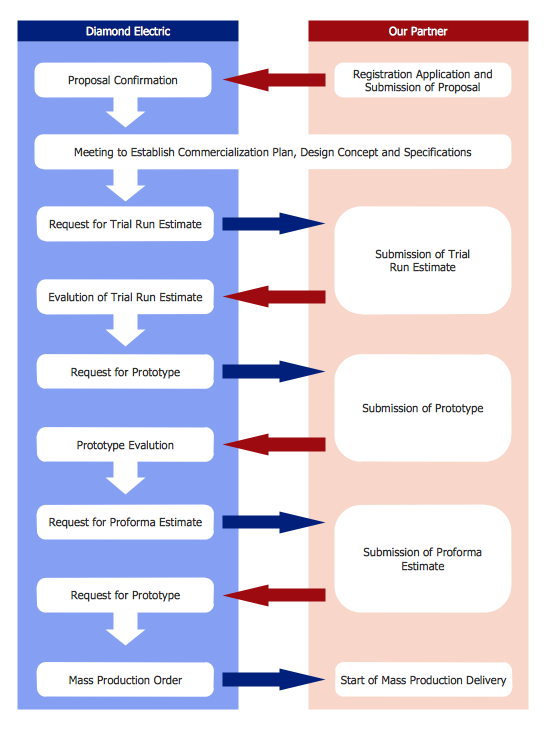
BPR Diagram. Business Process Reengineering Example

This sample was created in ConceptDraw DIAGRAM diagramming and vector drawing software using the Business Process Diagram Solution from the Business Processes area of ConceptDraw Solution Park. The Business Process Solution is based on the standard BPMN 2.0 and includes the set of libraries of ready-to-use objects.

histogram, flow chart, pareto chart, fishbone diagram, quality control Seven Basic Tools of Quality

histogram, flow chart, pareto chart, fishbone diagram, quality control
Manage quality control in the workplace, using fishbone diagrams, flowcharts, Pareto charts and histograms, provided by the Seven Basic Tools of Quality solution.

Fundraising Pyramid

ConceptDraw Pyramid Diagram software allows drawing column charts using predesigned objects or drawing tool.

Project — Working With Costs

ConceptDraw PROJECT delivers a rich set of built-in functionalities and optional product extensions that support your daily workflow in time-saving and creative ways. This video lesson will teach you how to work with costs in your project document.

Restaurant Floor Plans

Making design interior restaurant or café floor plan can be hard and very complicated unless you have ConceptDraw DIAGRAM software which can do all drawing for you offering lots of templates, samples of floor plans and many other plans and schemes, including even examples of numerous charts, flowcharts and diagrams.

Flowchart Symbols Accounting. Activity-based costing (ABC) flowchart

This flow chart example represent activity-based costing flowchart (ABC flowchart): resource-catagories, resource cost drivers, activities, activity cost drivers, cost objects, direct materials, direct labour. This sort of accounting flowcharts intended to explain how costs distributed between company units and departments. There is only way to clearly explain activity-based cost distribution - create cost diagram demonstrating cost distribution relations and logics. ConceptDraw DIAGRAM is special software with accounting flowchart symbols and flowchart stencils for effective drawing activity-based cost flowcharts (ABC-flowcharts).

How to Report Task's Execution with Gantt Chart

ConceptDraw PROJECT’s powerful reporting engine lets you generate a set of tabular reports with just one click, or visualize your project as Radial Tasks Structures, Work Breakdown Structures and Resource Calendars. It also provides you with dynamic Project Dashboards.

Product Proposal Template

This template was created in ConceptDraw DIAGRAM diagramming and vector drawing software using the Block Diagrams Solution from the “Diagrams” area of ConceptDraw Solution Park.
This template shows the Product Proposal Diagram on that is displayed the sequence of the product planning steps. This diagram is convenient, visual and clear.

Flow Map

A Flow Map is a type of thinking maps which help easy organize and understand information. It consists of the set of boxes and arrows, and visually displays a sequence of events.
ConceptDraw DIAGRAM diagramming and vector drawing software extended with Flowcharts Solution from the "Diagrams" Area of ConceptDraw Solution Park allows you to draw in a few minutes the Flow Map of any degree of complexity.