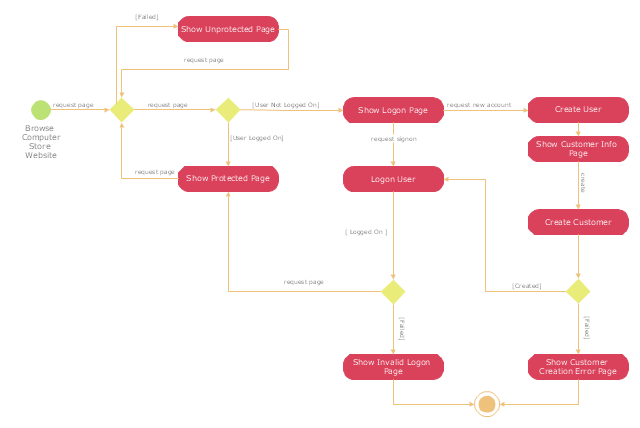
"A registered user is one who uses a program or a website and provides his/ her credentials, effectively proving his/ her identity. ...
Generally speaking, any person can become a registered user by providing some credentials, usually in the form of a username (or email) and password. After that, one can access information and privileges unavailable to non-registered users, usually referred to simply as guests. The action of providing the proper credentials for a website is called logging in, or signing in." [Registered user. Wikipedia]
The UML activity diagram example "User registration" was created using the ConceptDraw PRO diagramming and vector drawing software extended with the Rapid UML solution from the Software Development area of ConceptDraw Solution Park.
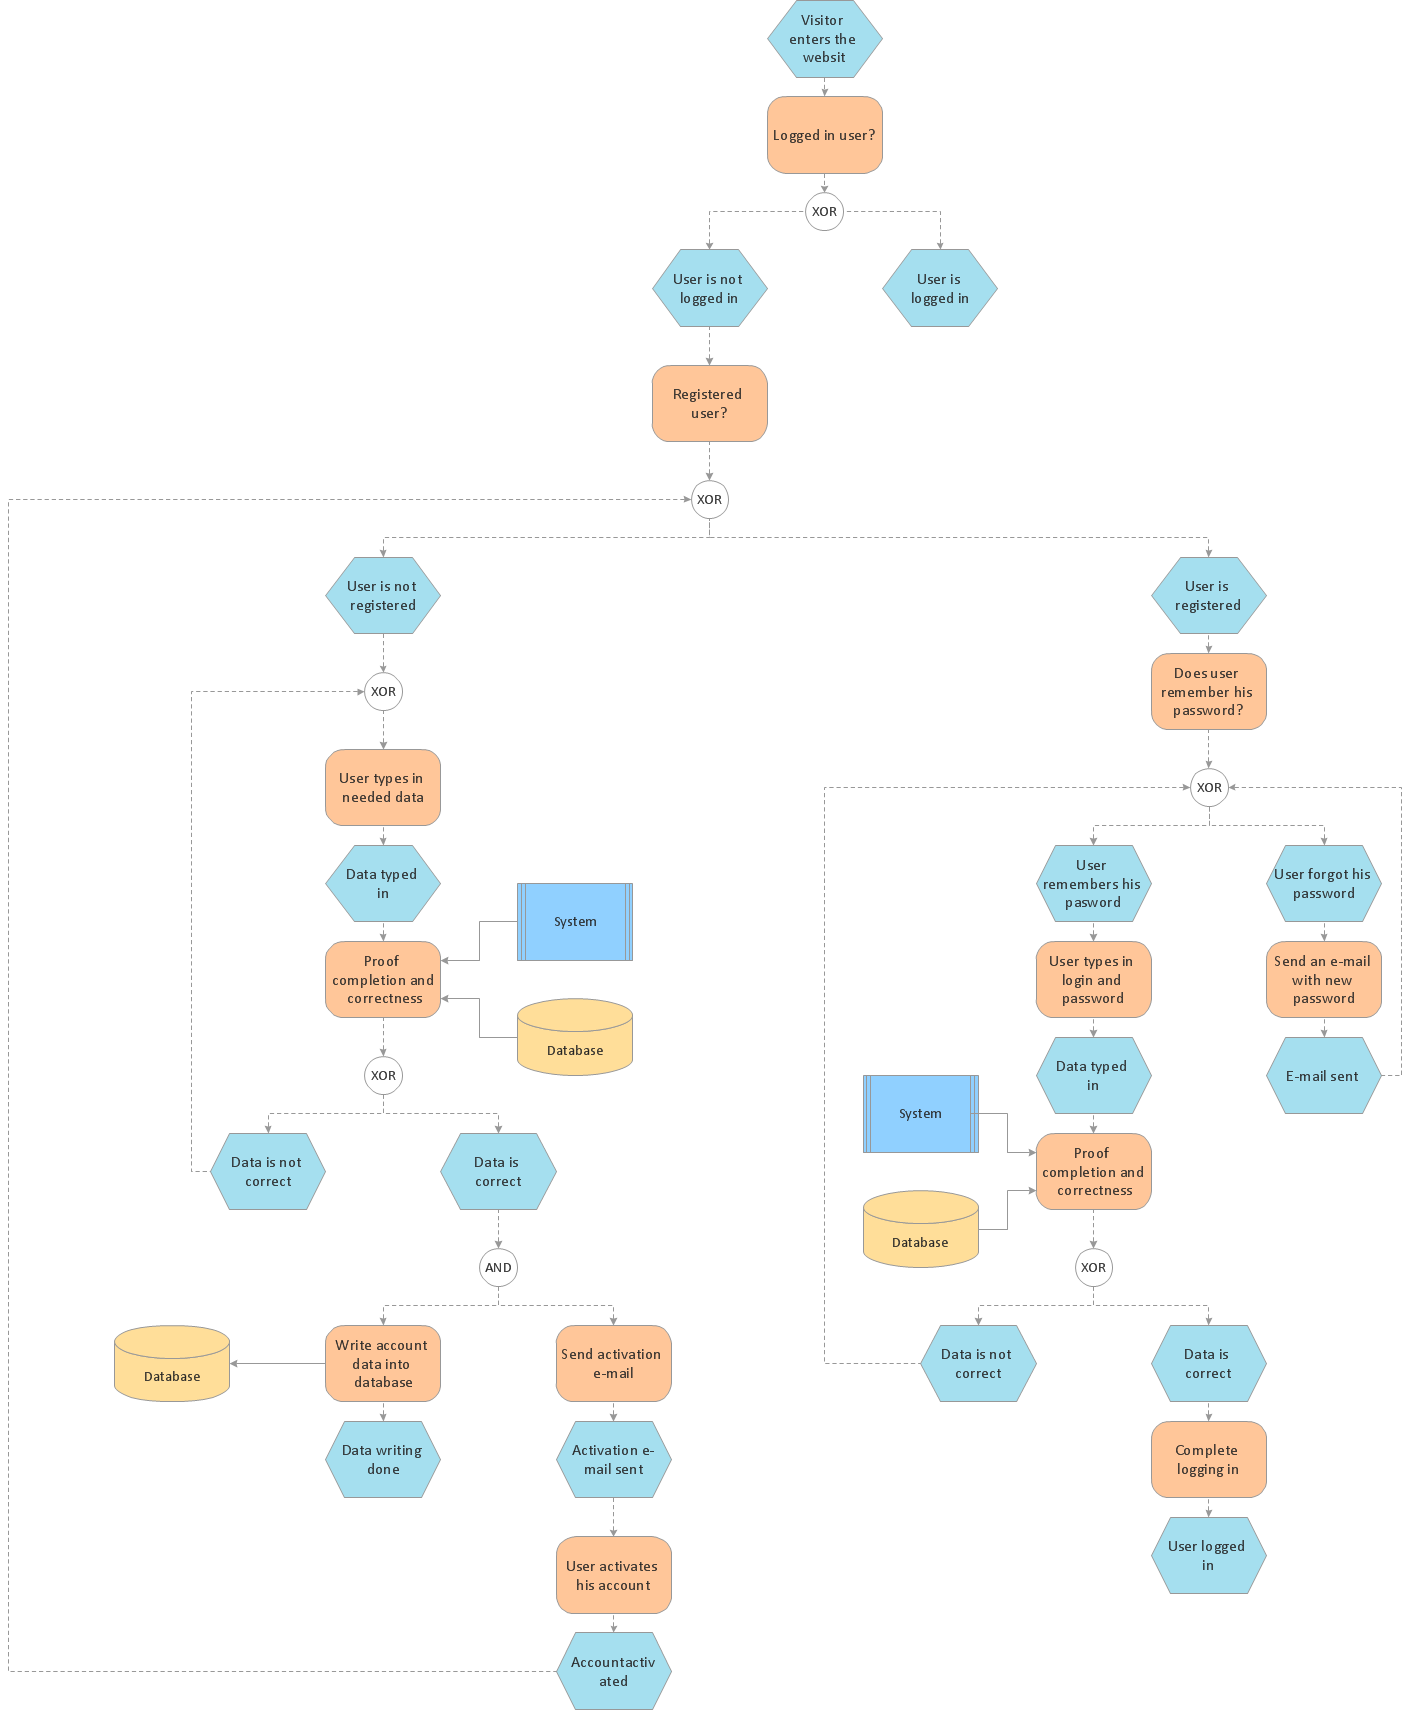
UML activity diagram
UML Use Case Diagram Example. Registration System

UML Deployment Diagram Example - ATM System UML diagrams

How to Help Customers be More Productive
Work Order Process Flowchart. Business Process Mapping Examples

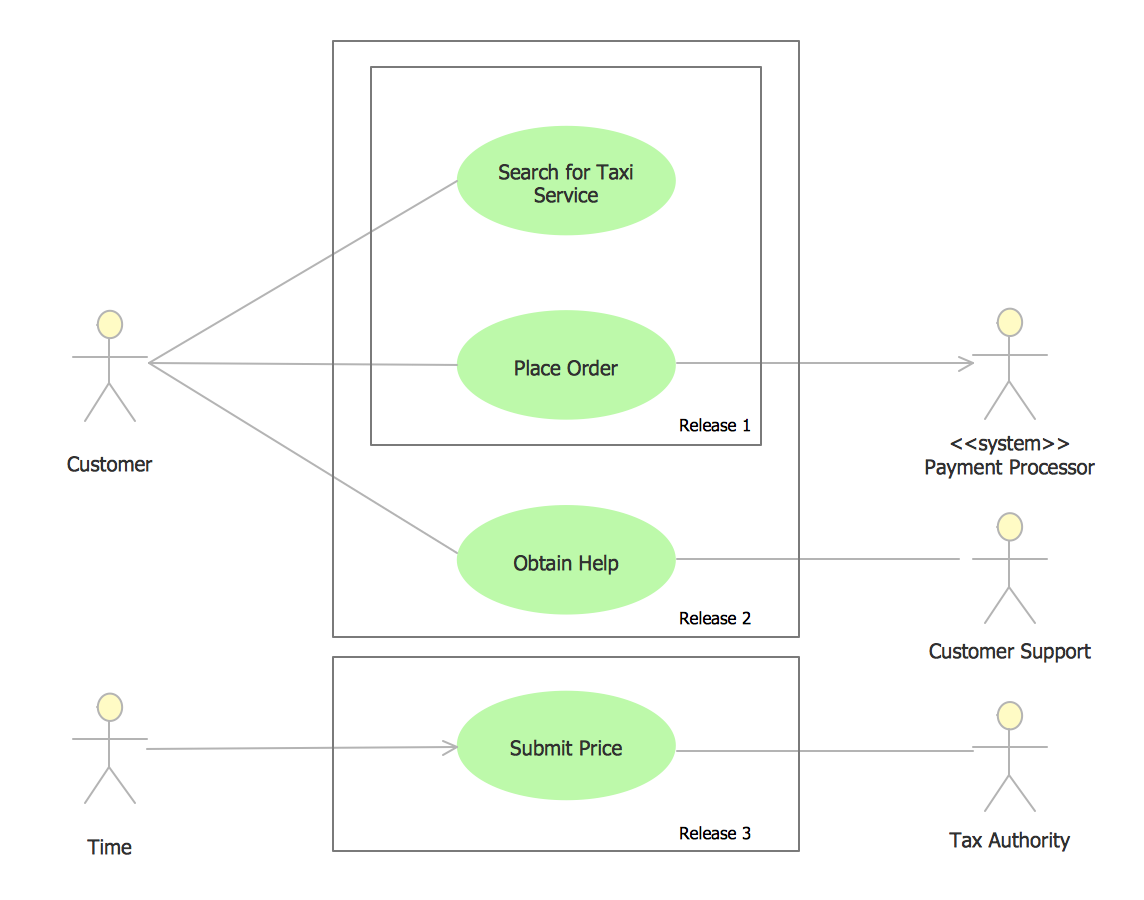
UML Use Case Diagram Example - Taxi Service
Example of DFD for Online Store (Data Flow Diagram)


 Event-driven Process Chain Diagrams
Event-Driven Process Chain Diagrams solution extends ConceptDraw DIAGRAM functionality with event driven process chain templates, samples of EPC engineering and modeling the business processes, and a vector shape library for drawing the EPC diagrams and EPC flowcharts of any complexity. It is one of EPC IT solutions that assist the marketing experts, business specialists, engineers, educators and researchers in resources planning and improving the business processes using the EPC flowchart or EPC diagram. Use the EPC solutions tools to construct the chain of events and functions, to illustrate the structure of a business process control flow, to describe people and tasks for execution the business processes, to identify the inefficient businesses processes and measures required to make them efficient.
Gane Sarson Diagram

ERD Symbols and Meanings


- Contoh Flowchart | UML activity diagram - User registration | Cross ...
- UML activity diagram - User registration | UML Use Case Diagram ...
- UML activity diagram - User registration | UML Use Case Diagram ...
- UML activity diagram - User registration
- UML Use Case Diagram Example Social Networking Sites Project ...
- Flowchart | UML Use Case Diagram Example Registration System ...
- Flowchart | UML Use Case Diagram Example Registration System ...
- UML Activity Diagram | UML activity diagram - User registration ...
- Contoh Use Case Diagram Atm System
- UML Use Case Diagram Example Registration System | Accounting ...
- UML activity diagram - User registration | UML Use Case Diagram ...
- Flowchart | Types of Flowcharts | Flow chart Example. Warehouse ...
- UML Use Case Diagram Example Registration System | UML activity ...
- UML Class Diagram Generalization Example UML Diagrams ...
- UML Class Diagram Generalization Example UML Diagrams | Event ...
- Contoh Activity Diagram Multi User
- UML Use Case Diagram Example Social Networking Sites Project ...
- UML Use Case Diagram Example Registration System | UML ...
- Login and registration processing - EPC diagram | Flowchart ...
- Final Account Information Diagram