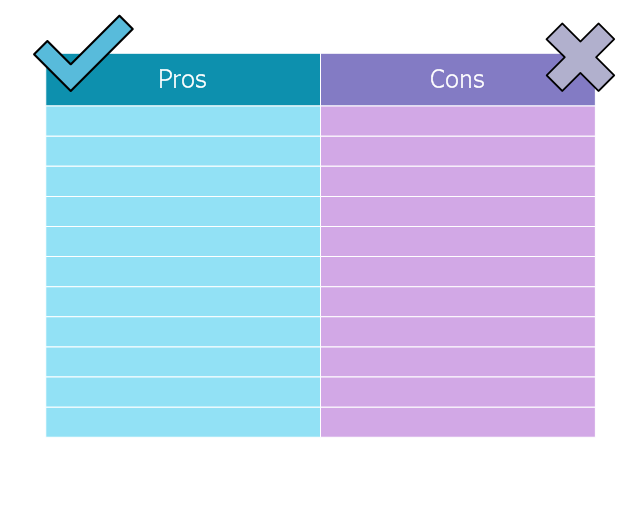
This is T-chart template for ConceptDraw software.
"T-Chart.
A simple way to conduct economic analysis through partial budgeting is with a T-chart. A T-chart systematically identifies only the benefits and costs of a conservation alternative. This technique simplifies data collection and analysis. The T-chart also describes the resource setting, resource concerns and the conservation system. The best information used in the T-chart comes from your client, a discipline specialist’s recommendations, and technical references. ...
There can be three levels of analysis using the T-chart:
• Level I Includes only qualitative statements
• Level II Qualitative statement plus units of measurement and dollars
• Level III Complete economic or financial analysis
The conservation planner should complete as many T-chart levels as they are comfortable with and then request assistance if the decision maker needs additional analysis. The planner only develops enough information for the client to make an informed decision. The decision maker may lose interest if too much irrelevant information is provided and waste planner’s time. A T-chart can be developed on whatever media the decision maker finds most useful." [nrcs.usda.gov/ Internet/ FSE_ DOCUMENTS/ stelprdb1176611.pdf]
The template "T-chart" is included in Decision Making solution from Management area of ConceptDraw Solution Park.
Chart Examples
Easy charting software comes with beautiful chart templates and examples. This makes it easy to create professional charts without prior experience.
 Chemical and Process Engineering
This chemical engineering solution extends ConceptDraw DIAGRAM.9.5 (or later) with process flow diagram symbols, samples, process diagrams templates and libraries of design elements for creating process and instrumentation diagrams, block flow diagrams (BFD
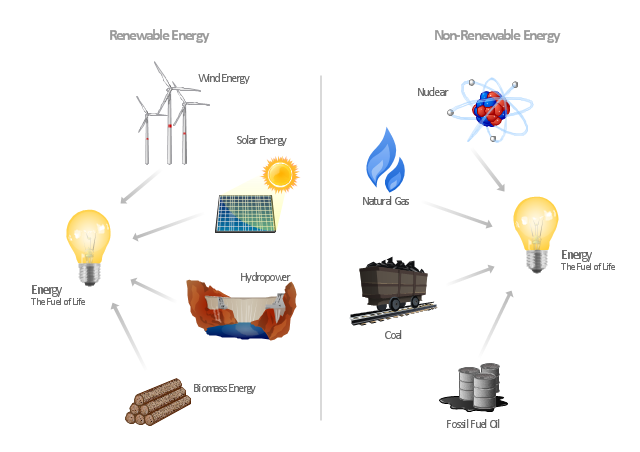
"Consumption of energy resources, (e.g. turning on a light) requires resources and has an effect on the environment. Many electric power plants burn coal, oil or natural gas in order to generate electricity for energy needs. While burning these fossil fuels produces a readily available and instantaneous supply of electricity, it also generates air pollutants including carbon dioxide (CO2), sulfur dioxide and trioxide (SOx) and nitrogen oxides (NOx). Carbon dioxide is an important greenhouse gas which is thought to be responsible for some fraction of the rapid increase in global warming seen especially in the temperature records in the 20th century, as compared with tens of thousands of years worth of temperature records which can be read from ice cores taken in Arctic regions. Burning fossil fuels for electricity generation also releases trace metals such as beryllium, cadmium, chromium, copper, manganese, mercury, nickel, and silver into the environment, which also act as pollutants.
The large-scale use of renewable energy technologies would "greatly mitigate or eliminate a wide range of environmental and human health impacts of energy use". Renewable energy technologies include biofuels, solar heating and cooling, hydroelectric power, solar power, and wind power. Energy conservation and the efficient use of energy would also help." [Energy industry. Environmental impact. Wikipedia]
The Energy resources diagram example was created in the ConceptDraw PRO diagramming and vector drawing software using the Manufacturing and Maintenance solution from the Illustration area of ConceptDraw Solution Park.
Chart Templates
Easy charting software comes with beautiful chart templates and examples. This makes it easy to create professional charts without prior experience.Pie Chart Examples and Templates
A pie chart or a circle graph is a circular chart divided into sectors, illustrating numerical proportion. In a pie chart, the arc length of each sector and consequently its central angle and area, is proportional to the quantity it represents. Pie chart examples and templates created using ConceptDraw DIAGRAM software helps you get closer with pie charts and find pie chart examples suite your needs.Donut Chart Templates
These donut chart templates was designed using ConceptDraw DIAGRAM diagramming and vector drawing software extended with Pie Charts solution from Graphs and Charts area of ConceptDraw Solution Park. All these donut chart templates are included in the Pie Charts solution. You can quickly rework these examples into your own charts by simply changing displayed data, title and legend texts.Pie Chart Examples and Templates
A pie chart or a circle graph is a circular chart divided into sectors, illustrating numerical proportion. In a pie chart, the arc length of each sector and consequently its central angle and area, is proportional to the quantity it represents. Pie chart examples and templates created using ConceptDraw DIAGRAM software helps you get closer with pie charts and find pie chart examples suite your needs.
 Chemistry
This solution extends ConceptDraw DIAGRAM software with samples, template and libraries of vector stencils for drawing the Chemistry Illustrations for science and education.
 Health Sciences
Health Sciences solution including professionally designed samples and wide range of high-quality vector icons and pictograms of basic medical sciences, surgery specializations, internal medicine, medical diagnostics, interdisciplinary fields, mental health, obstetrics and gynecology, public health, allied health, and other medical specialties, is a perfect assistant in drawing Health diagrams, schematics, illustrations, infographics and slides for presentations on the healthcare, medical and health sciences thematic, in development knowledge in health science, in studying and representing the physical, mental and social aspects of human health, in determining the role of different health sciences at this process, finding and explaining new methods of treatment different diseases, making an overview and describing the main characteristics of health sciences in a visual form.
- Chart Showing Conservation Of Resources To Draw
- Energy resources diagram | Conservation Of Natural Resources ...
- Circular Arrows Diagrams | Pie Chart On Conservation Of Resources
- Energy resources diagram | Chart Examples | Chart Templates ...
- Pie Chart For Conservation Of Natural Resources
- Pie Chart On Conservation Energy Resources
- Energy resources diagram | CMP adaptive management cycle | Geo ...
- Circular Arrows Diagrams | Energy resources diagram ...
- Pie Chart Of Conservation Of Natural Resources
- Pie Chart On Conservation Of Natural Resources


