 Comparison Dashboard
Comparison dashboard solution extends ConceptDraw PRO software with samples, templates and vector stencils library with charts and indicators for drawing the visual dashboard comparing data.
The template "Comparison dashboard" for the ConceptDraw PRO diagramming and vector drawing software is included in the Comparison Dashboard solution from the area "What is a Dashboard" of ConceptDraw Solution Park.
Visual dashboard template
The vector stencils library Comparison charts contains 4 Live Objects: Horizontal bar chart, Column chart (Vertical bar chart), Line chart and Dot plot (Scatter chart).
The vector stencils library Comparison indicators contains 7 Live Objects:
Two column indicator, Two bubbles indicator, Scales indicator, Left and right arrows indicator, Up and down arrows indicator, Two up arrows indicator.
The ConceptDraw Live Objects are ready-to-use templates of charts and visual indicators for dashboard design. You can set data source file for Each Live Object, and your charts or indicators will represents actual data from the data source files, and change their appearance with changing of the data in source files. The comparison charts and indicators are useful to compare and rank of your data by categories.
Use the design elements libraries "Comparison charts" and "Comparison indicators" to create your own business visual dashboards using the ConceptDraw PRO diagramming and vector drawing software.
The example "Design elements - Comparison charts and indicators" is included in the Comparison Dashboard solution from the area "What is a Dashboard" of ConceptDraw Solution Park.
Data comparison charts and visual indicators

 ConceptDraw Solution Park
ConceptDraw Solution Park collects graphic extensions, examples and learning materials
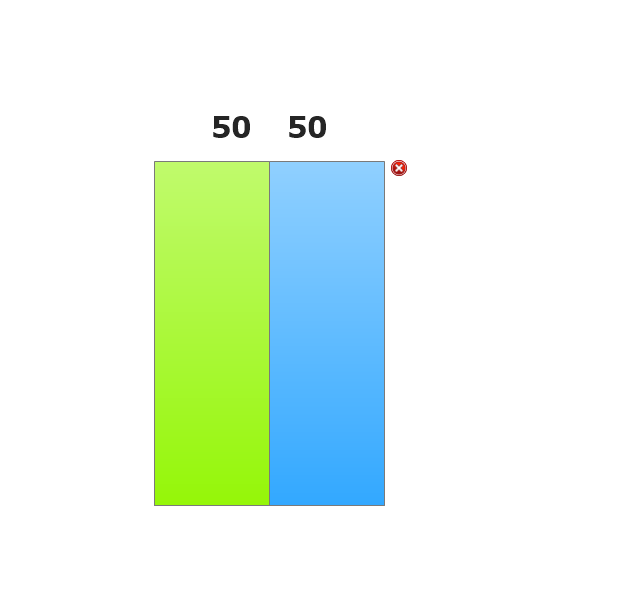
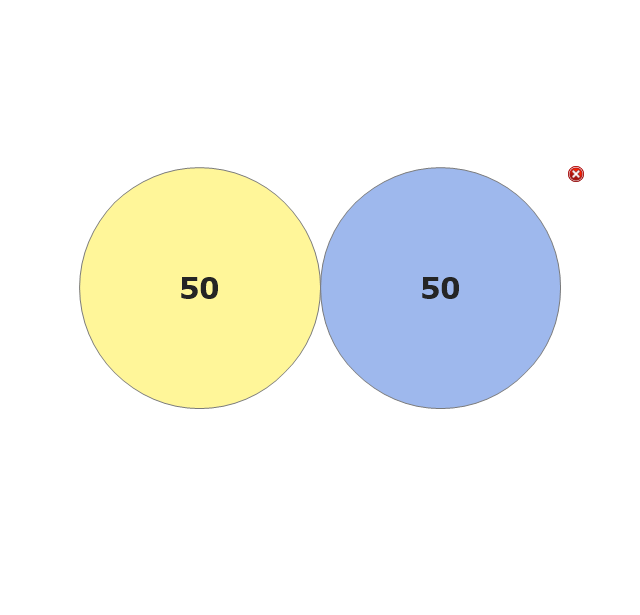
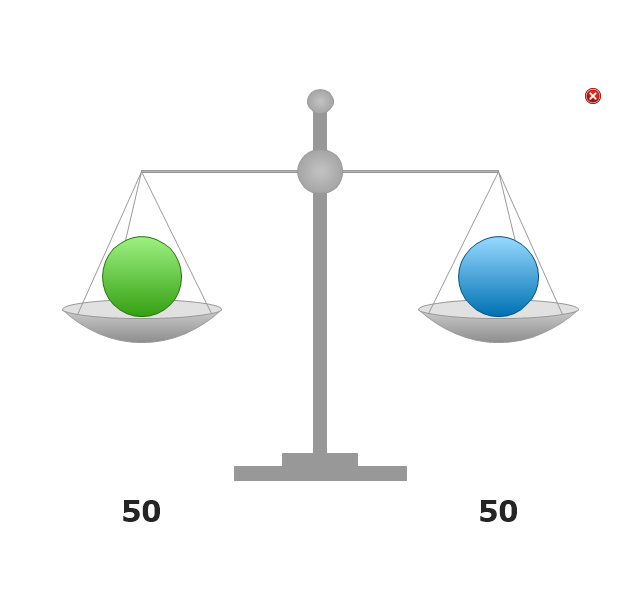
The vector stencils library "Comparison indicators" contains 6 comparison indicators.
Comparison indicators are Live Objects which show the comparison of two items.
Use it for drawing visual dashboards in the ConceptDraw PRO diagramming and vector drawing software extended with the Comparison Dashboard solution from the area "What is a Dashboard" of ConceptDraw Solution Park.
www.conceptdraw.com/ solution-park/ comparison-dashboard
Two Columns Indicator
Two Bubbles Indicator
Scales Indicator
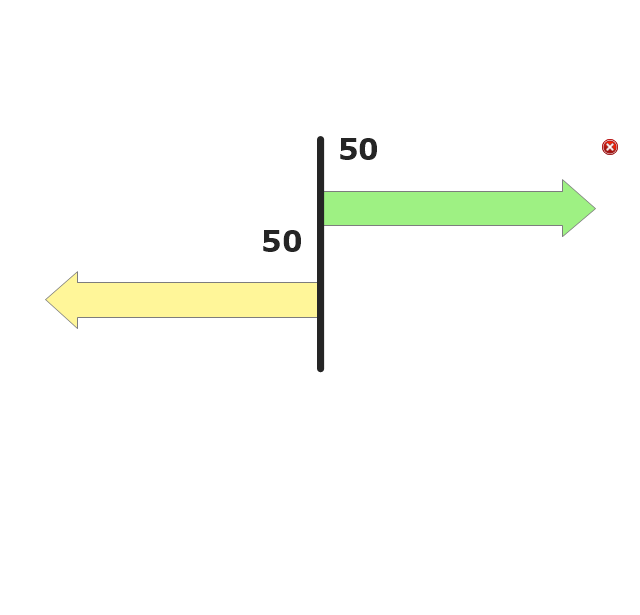
Left and Right Arrows Indicator
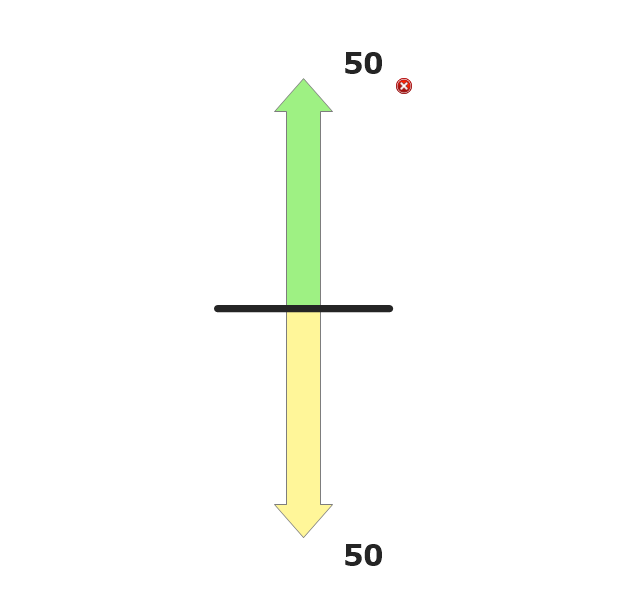
Up and Down Arrows Indicator
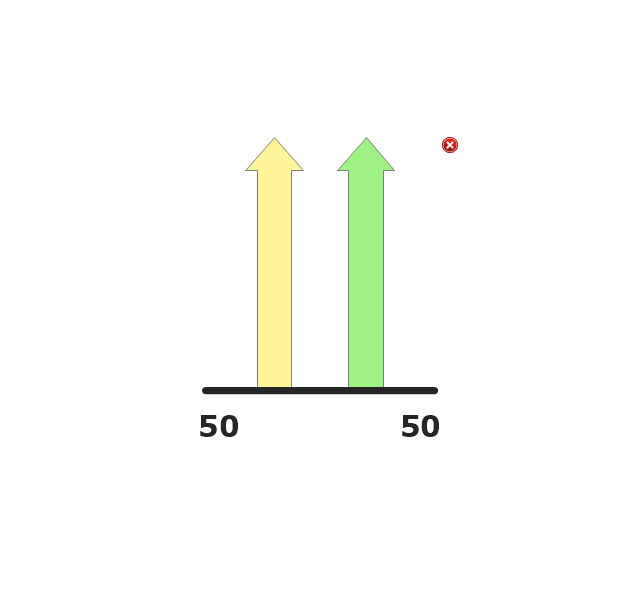
Two Up Arrows Indicator
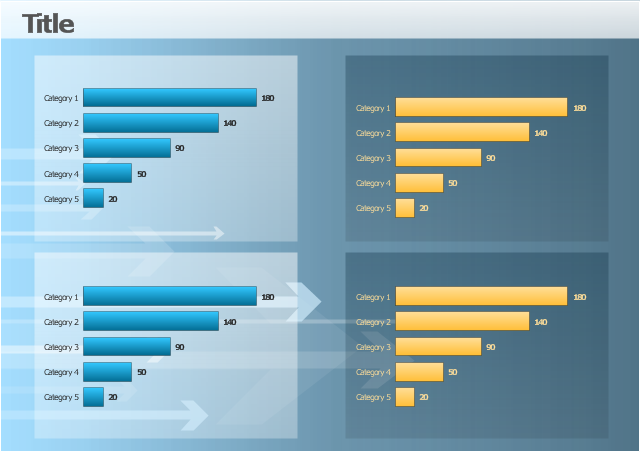
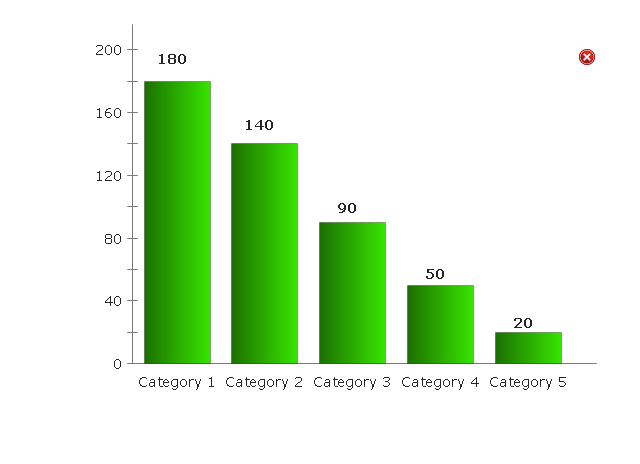
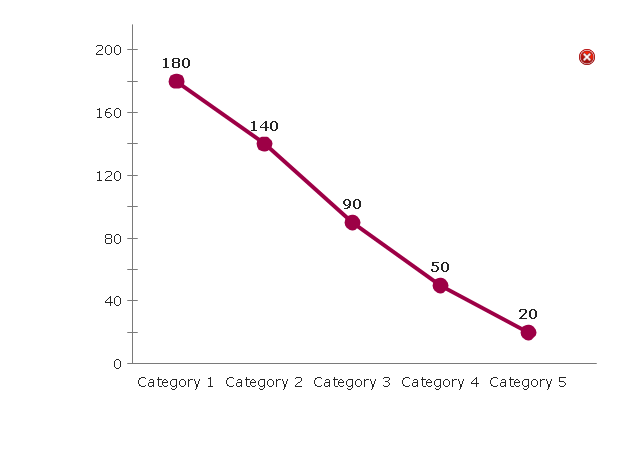
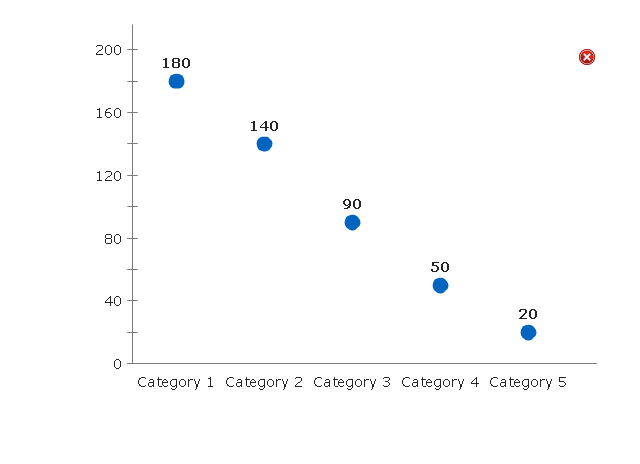
The vector stencils library "Comparison charts" contains 4 Live Objects: Horizontal bar chart template, Column chart (Vertical bar chart) template, Line chart template and Dot plot (Scatter chart) template.
Use it for drawing visual dashboards in the ConceptDraw PRO diagramming and vector drawing software extended with the Comparison Dashboard solution from the area "What is a Dashboard" of ConceptDraw Solution Park.
www.conceptdraw.com/ solution-park/ comparison-dashboard
Use it for drawing visual dashboards in the ConceptDraw PRO diagramming and vector drawing software extended with the Comparison Dashboard solution from the area "What is a Dashboard" of ConceptDraw Solution Park.
www.conceptdraw.com/ solution-park/ comparison-dashboard
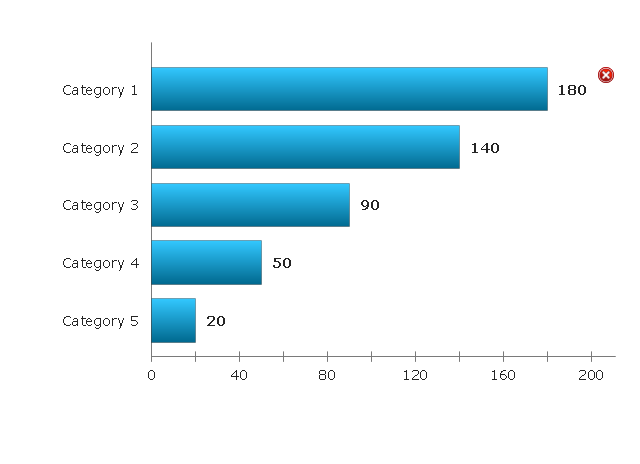
Horizontal Bar Chart
Column Chart
Line Chart
Dot Plot
 Sales Dashboard
Sales Dashboard solution extends ConceptDraw PRO software with templates, samples and library of vector stencils for drawing the visual dashboards of sale metrics and key performance indicators (KPI).
 What is a Dashboard Area
Solutions from the area What is a Dashboard of ConceptDraw Solution Park collects templates, samples and vector stencils libraries with of data driven charts and indicators for drawing the basic types of Visual Dashboards.
 Meter Dashboard
Meter dashboard solution extends ConceptDraw PRO software with templates, samples and vector stencils library with meter indicators for drawing visual dashboards showing quantitative data.
The vector stencils library "Comparison charts" contains 4 Live Objects: Horizontal bar chart template, Column chart (Vertical bar chart) template, Line chart template and Dot plot (Scatter chart) template.
Use it for drawing visual dashboards in the ConceptDraw PRO diagramming and vector drawing software extended with the Comparison Dashboard solution from the area "What is a Dashboard" of ConceptDraw Solution Park.
www.conceptdraw.com/ solution-park/ comparison-dashboard
Use it for drawing visual dashboards in the ConceptDraw PRO diagramming and vector drawing software extended with the Comparison Dashboard solution from the area "What is a Dashboard" of ConceptDraw Solution Park.
www.conceptdraw.com/ solution-park/ comparison-dashboard
Horizontal Bar Chart
Column Chart
Line Chart
Dot Plot
The vector stencils library "Comparison indicators" contains 6 comparison indicators.
Comparison indicators are Live Objects which show the comparison of two items.
Use it for drawing visual dashboards in the ConceptDraw PRO diagramming and vector drawing software extended with the Comparison Dashboard solution from the area "What is a Dashboard" of ConceptDraw Solution Park.
www.conceptdraw.com/ solution-park/ comparison-dashboard
Comparison indicators are Live Objects which show the comparison of two items.
Use it for drawing visual dashboards in the ConceptDraw PRO diagramming and vector drawing software extended with the Comparison Dashboard solution from the area "What is a Dashboard" of ConceptDraw Solution Park.
www.conceptdraw.com/ solution-park/ comparison-dashboard
Two Columns Indicator
Two Bubbles Indicator
Scales Indicator
Left and Right Arrows Indicator
Up and Down Arrows Indicator
Two Up Arrows Indicator
 Frequency Distribution Dashboard
Frequency distribution dashboard solution extends ConceptDraw PRO software with samples, templates and vector stencils libraries with histograms and area charts for drawing the visual dashboards showing frequency distribution of data.
 Composition Dashboard
Composition dashboard solution extends ConceptDraw PRO software with templates, samples and vector stencils library with charts and indicators for drawing visual dashboards showing data composition.
 Spatial Dashboard
Spatial dashboard solution extends ConceptDraw PRO software with templates, samples and vector stencils libraries with thematic maps for drawing visual dashboards showing spatial data.
 Correlation Dashboard
Correlation dashboard solution extends ConceptDraw PRO software with samples, templates and vector stencils library with Scatter Plot Charts for drawing the visual dashboard visualizing data correlation.
 Time Series Dashboard
Time series dashboard solution extends ConceptDraw PRO software with templates, samples and vector stencils libraries with charts, graphs and plots for drawing the visual dashboards showing data time series.
 Status Dashboard
Status dashboard solution extends ConceptDraw PRO software with templates, samples and vector stencils libraries with graphic indicators for drawing the visual dashboards showing status data.
 PM Dashboards
This solution extends ConceptDraw PRO and ConceptDraw PROJECT software with the ability to clearly display the identified key performance indicators for any project.
This financila dashboard example was drawn on the base of the Enterprise dashboard from the Mecklenburg County Government website.
[charmeck.org/ mecklenburg/ county/ CountyManagersOffice/ OMB/ dashboards/ Pages/ Enterprise.aspx]
"In management information systems, a dashboard is "an easy to read, often single page, real-time user interface, showing a graphical presentation of the current status (snapshot) and historical trends of an organization’s key performance indicators to enable instantaneous and informed decisions to be made at a glance."
For example, a manufacturing dashboard may show key performance indicators related to productivity such as number of parts manufactured, or number of failed quality inspections per hour. Similarly, a human resources dashboard may show KPIs related to staff recruitment, retention and composition, for example number of open positions, or average days or cost per recruitment.
Types of dashboards.
Dashboard of Sustainability screen shot illustrating example dashboard layout.
Digital dashboards may be laid out to track the flows inherent in the business processes that they monitor. Graphically, users may see the high-level processes and then drill down into low level data. This level of detail is often buried deep within the corporate enterprise and otherwise unavailable to the senior executives.
Three main types of digital dashboard dominate the market today: stand alone software applications, web-browser based applications, and desktop applications also known as desktop widgets. The last are driven by a widget engine.
Specialized dashboards may track all corporate functions. Examples include human resources, recruiting, sales, operations, security, information technology, project management, customer relationship management and many more departmental dashboards.
Digital dashboard projects involve business units as the driver and the information technology department as the enabler. The success of digital dashboard projects often depends on the metrics that were chosen for monitoring. Key performance indicators, balanced scorecards, and sales performance figures are some of the content appropriate on business dashboards." [Dashboard (management information systems). Wikipedia]
The example "Enterprise dashboard" was created using the ConceptDraw PRO diagramming and vector drawing software extended with the Composition Dashboard solution from the area "What is a Dashboard" of ConceptDraw Solution Park.
Financial dashboard

- Marketing | Comparison Dashboard | Fishbone Diagram | Solution ...
- Column Chart Software | Bar Chart Software | What is a Dashboard ...
- Marketing | Feature comparison chart - Digital scouting cameras ...
- Comparison Dashboard | What is a Dashboard Area | Spatial ...
- Marketing | PM Agile | Comparison Dashboard | Comparison Table ...
- Composition Dashboard | What is a Dashboard Area | Comparison ...
- Design elements - Comparison charts and indicators | Comparison ...
- Comparison Dashboard | SWOT Sample in Computers | Matrices ...
- Marketing | SWOT analysis matrix diagram templates | Comparison ...
- Comparison Dashboard | ConceptDraw Solution Park | Marketing ...
- Comparison Dashboard | Composition Dashboard | Marketing ...
- Design elements - Comparison charts and indicators | What is a ...
- MindWave for SAP Streamworks | Comparison Dashboard | What is ...
- Comparing ConceptDraw PRO to Omnigraffle | Comparison ...
- Comparison dashboard - Template
- Design elements - Comparison charts and indicators | Design ...
- Design elements - Time series charts | Design elements ...
- What is a Dashboard Area | iPhone OS (iOS) graphic user interface ...
- Competitive feature comparison matrix chart - Digital scouting cameras