This site uses cookies. By continuing to browse the ConceptDraw site you are agreeing to our Use of Site Cookies.

Computer Hardware - Reseller Business Plan

A more detailed mind map of a business plan for a computer hardware reseller.

ConceptDraw MINDMAP : Brainstorming, Mind Mapping for macOS and Windows

ConceptDraw MINDMAP is a powerful business and personal productivity software application that provides visual organization and access to information for individuals and organizations.

UML Class Diagram Example - Apartment Plan

UML Apartment Plan. This sample was created in ConceptDraw DIAGRAM diagramming and vector drawing software using the UML Class Diagram library of the Rapid UML Solution from the Software Development area of ConceptDraw Solution Park.
This sample show the detailed plan of the apartment and is used by building companies, design apartments, real estate agencies, at the buying / selling of the realty.
HelpDesk

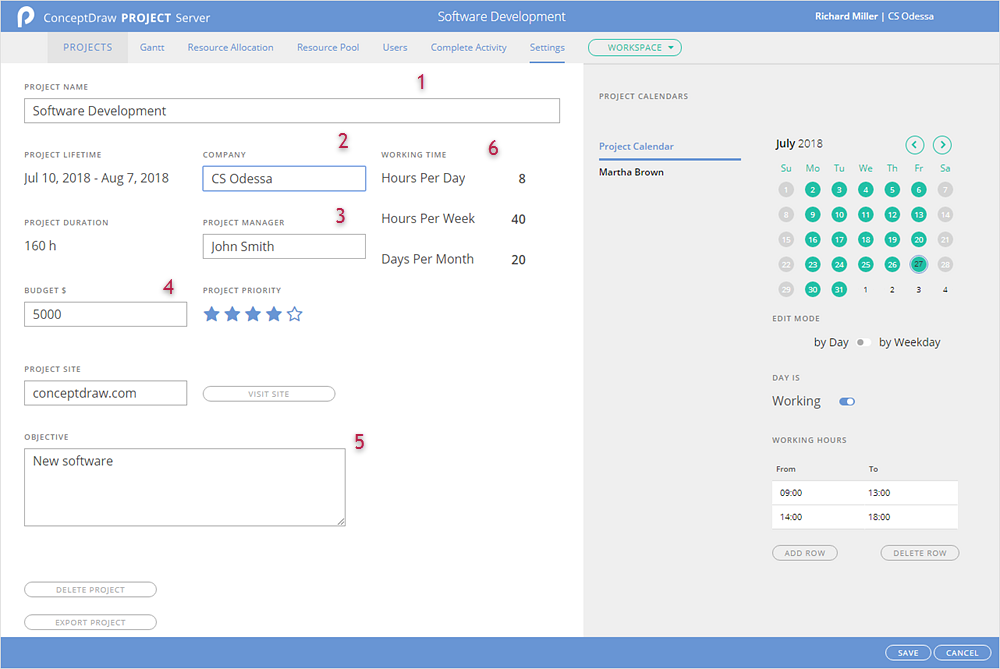
How to Adjust Project Settings

ConceptDraw PROJECT Server cloud storage can store a lot of project files: files uploaded by owner projects that are shared with him and a set of project-examples. A number of projects, you can upload and a number of participants you can invite depends on your tariff plan. You can view setup options of your project on The Project Settings page. Here, you can find out: currency of the project , first day of the week, the number of working hours per day and week, the amount of working days in a month, working hours by default, company name, start and finish date of the project, name of the project manager, and project objectives.

Gant Chart in Project Management

Gant Chart is a graphical representation of tasks as segments on a time scale. It helps plan and monitor project development or resource allocation. The horizontal axis is a time scale, expressed either in absolute or relative time.
what is software project management

Cause and Effect Analysis

Cause and Effect Analysis - The Seven Management and Planning Tools is a tool for Cause and Effect Analysis that allows users to analyze the root causes for factors that influenced the problem. This diagram is constructed separately for each highly prioritized factor. The Diagram is then used for further formulation of potential actions.
7MP Tools
7MP Tools

Basic Flowchart Symbols and Meaning

Flowchart Symbols and Meaning - Provides a visual representation of basic flowchart symbols and their proposed use in professional workflow diagram, standard process flow diagram and communicating the structure of a well-developed web site, as well as their correlation in developing on-line instructional projects. See flowchart's symbols by specifics of process flow diagram symbols and workflow diagram symbols.
How to Build a Flowchart

Interior Design. Office Layout Plan Design Element

While developing an office layout, it is important to choose a right office space. One should take into account that some layouts are suitable for frequent communication among employees and are inappropriate for a high level of concentration, and vice versa, private offices are not convenient for frequent communication.
ConceptDraw Building Drawing Tools - draw simple office layout plans easily with Office Layout Plan Design Element. Use it to draw office interior design floor plans, office furniture and equipment layouts, and blueprints for facilities management, move management, office supply inventories, assets inventories, office space planning.
How to Draw a Floor Plan

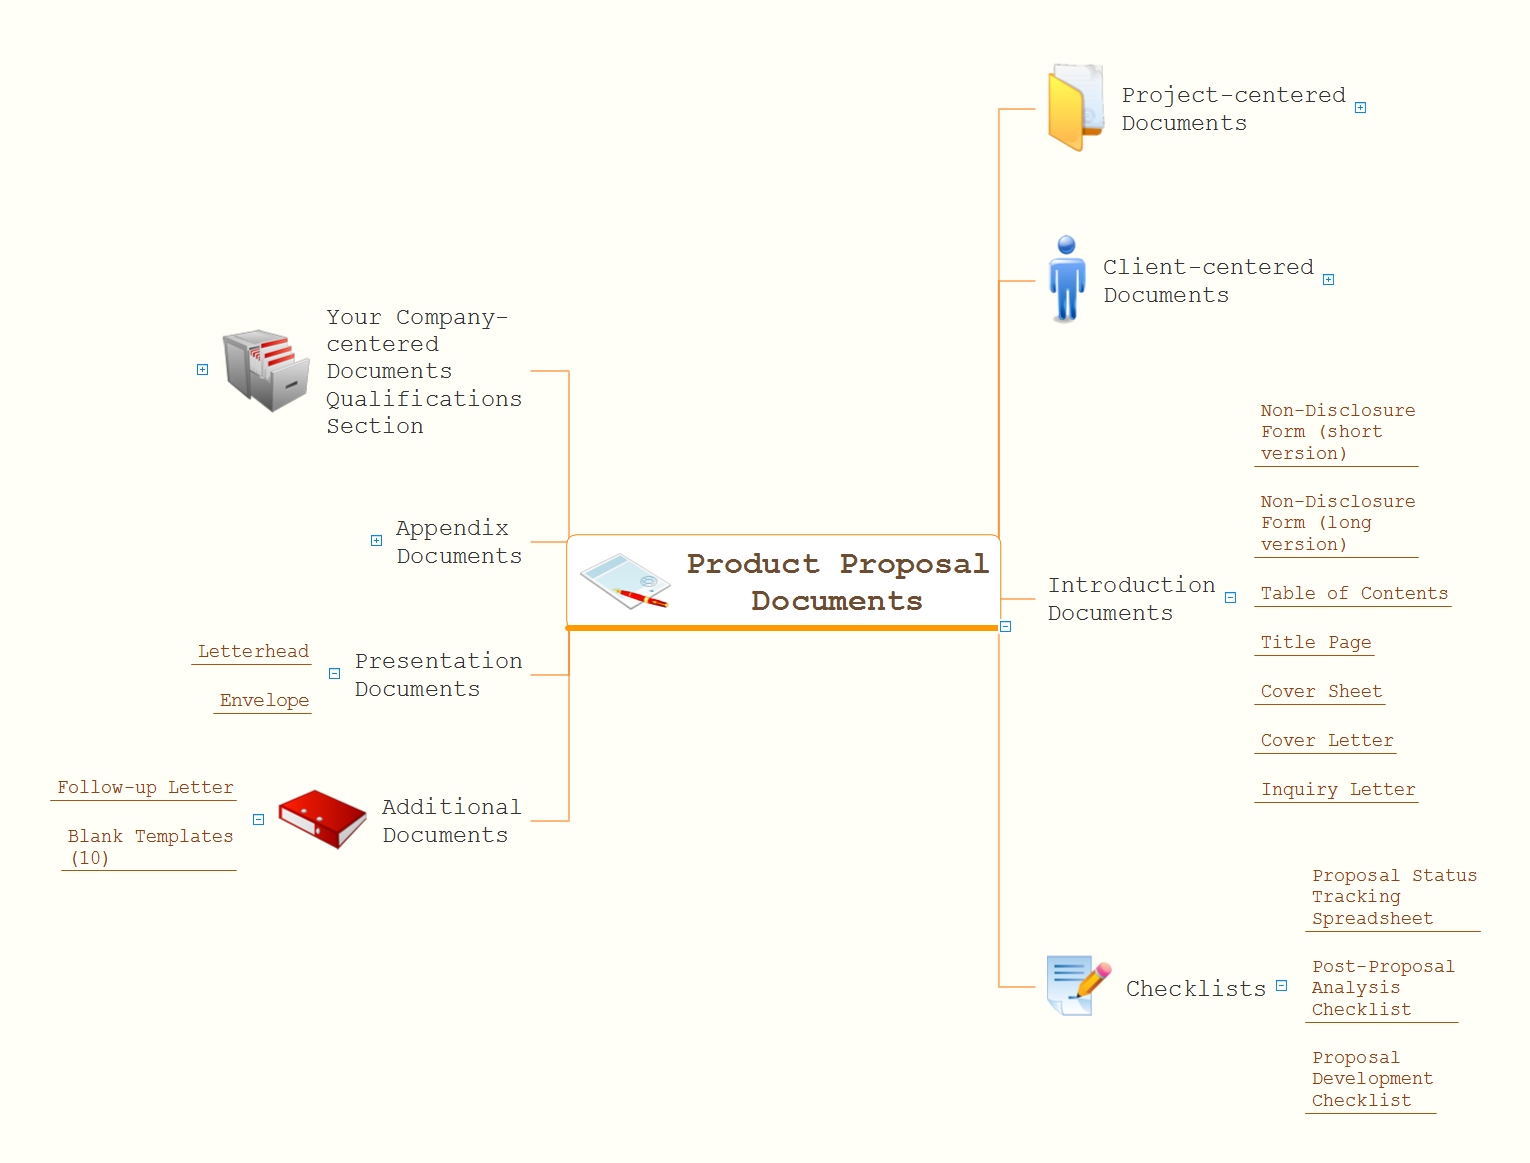
Product Proposal Documents Expanded

A more detailed mind map that organizes documents required for a product proposal.

Software Work Flow Process in Project Management with Diagram

This sample was created in ConceptDraw DIAGRAM diagramming and vector drawing software using the Workflow Diagrams Solution from the Software Development area of ConceptDraw Solution Park.

This sample shows the Workflow Diagram that clearly illustrates stages a BPM consists of and relations between all parts of business. The Workflow Diagrams are used to represent the transferring of data during the work process, to study and analysis the working processes, and to optimize a workflow.