 Illustration
This solution extends ConceptDraw PRO v9.4, allowing you to make professional-looking documents, presentations and websites illustrated with color, scalable vector clip art and shapes, regardless of drawing skills.
"Driving is the controlled operation and movement of a vehicle, such as a car, carriage, truck or bus. ...
Driving as a physical skill.
A driver must have physical skills to be able to control direction, acceleration, and deceleration. For motor vehicles, the detailed tasks include:
(1) Starting the vehicle's engine with the starting system.
(2) Setting the transmission to the correct gear.
(3) Depressing the pedals with one's feet to accelerate, slow, and stop the vehicle, and if the vehicle is equipped with a manual transmission, to modulate the clutch.
(4) Steering the vehicle's direction with the steering wheel.
(5) Operating other important ancillary devices such as the indicators, headlights, and windshield wipers.
(6) Observing the environment for hazards." [Driving. Wikipedia]
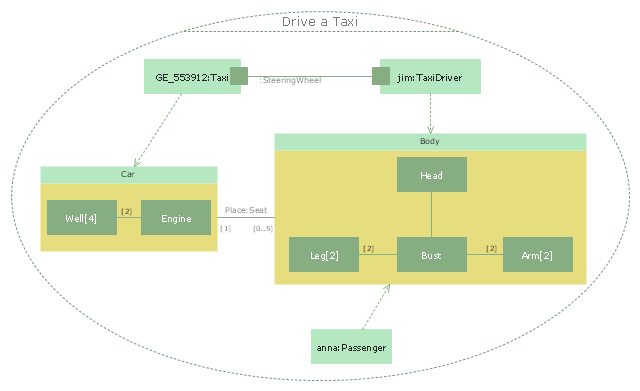
The UML composite structure diagram example "Drive a taxi" was created using the ConceptDraw PRO diagramming and vector drawing software extended with the Rapid UML solution from the Software Development area of ConceptDraw Solution Park.
Driving as a physical skill.
A driver must have physical skills to be able to control direction, acceleration, and deceleration. For motor vehicles, the detailed tasks include:
(1) Starting the vehicle's engine with the starting system.
(2) Setting the transmission to the correct gear.
(3) Depressing the pedals with one's feet to accelerate, slow, and stop the vehicle, and if the vehicle is equipped with a manual transmission, to modulate the clutch.
(4) Steering the vehicle's direction with the steering wheel.
(5) Operating other important ancillary devices such as the indicators, headlights, and windshield wipers.
(6) Observing the environment for hazards." [Driving. Wikipedia]
The UML composite structure diagram example "Drive a taxi" was created using the ConceptDraw PRO diagramming and vector drawing software extended with the Rapid UML solution from the Software Development area of ConceptDraw Solution Park.
UML composite structure diagram
This sale dashboard example contains KPIs and sales effectiveness metrics visual indicators: speedometer gauge, dial, slider, level meter and bullet indicators.
"Sales effectiveness refers to the ability of a company’s sales professionals to “win” at each stage of the customer’s buying process, and ultimately earn the business on the right terms and in the right timeframe.
Improving sales effectiveness is not just a sales function issue; it’s a company issue, as it requires deep collaboration between sales and marketing to understand what’s working and not working, and continuous improvement of the knowledge, messages, skills, and strategies that sales people apply as they work sales opportunities.
Sales effectiveness has historically been used to describe a category of technologies and consulting services aimed at helping companies improve their sales results.
Many companies are creating sales effectiveness functions and have even given people titles such as VP of Sales Effectiveness." [Sales effectiveness. Wikipedia]
The example "Sales metrics and KPIs" was created using the ConceptDraw PRO diagramming and vector drawing software extended with the Meter Dashboard solution from the area "What is a Dashboard" of ConceptDraw Solution Park.
Sales dashboard

 Venn Diagrams
Venn Diagrams are actively used to illustrate simple set relationships in set theory and probability theory, logic and statistics, mathematics and computer science, linguistics, sociology, and marketing. Venn Diagrams are also often used to visually summarize the status and future viability of a project.
ConceptDraw PRO Compatibility with MS Visio

Process Flowchart


- UML Collaboration Diagram Example Illustration | Rapid UML ...
- Business and Finance | UML Collaboration Diagram Example ...
- Diagramming Software for Design UML Collaboration Diagrams ...
- Business process diagram BPMN 1.2 - Hiring process | Cab booking ...
- Network Topology Illustration | Business and Finance Illustrations ...
- Business process diagram BPMN 1.2 - Hiring process | How to ...
- Business process diagram BPMN 1.2 - Hiring process | How to ...
- Circular diagrams - Vector stencils library | Collaboration life-cycle ...
- How to Create a BPMN Diagram Using Border Events in ...
- Cab booking public process - Collaboration BPMN 2.0 diagram ...
- Diagramming Software for UML Composite Structure Diagrams ...
- Vector graphics - Media signs | Design elements - Media signs ...
- UML composite structure diagram - Drive a taxi | Rapid UML | UML ...
- Remote Learning Sessions - Webinars | How to exchange data files ...
- Collaboration Diagram Of Transport Management System
- Business Process Modeling Notation Template | Business process ...
- UML Use Case Diagram Example - Taxi Service | Workflow ...
- Business process diagram BPMN 1.2 - Hiring process | BPMN 2.0 ...
- Business Process Modeling Notation Template | Business Process ...
- Business Process Modeling Software for Mac | Business process ...