This example of cloud computing system architecture diagram was created on base of the figure "Workflow to distribute workitems to pooled VMs" in the article "Azure Batch technical overview" from the Microsoft Azure website.
"Workitems workflow.
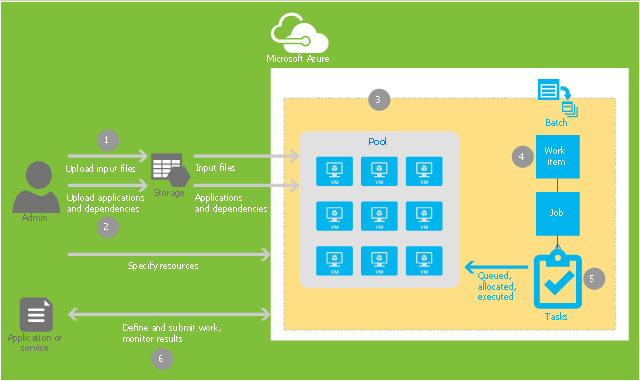
Figure 4 shows a you how to submit an application to a pool where it's distributed for processing. This uses the Batch API. ...
1. Upload input files (such as source data or images) required for a job to an Azure storage account. These files must be in the storage account so that the Batch service can access them. The Batch service loads them onto a TVM when the task runs.
2. Upload the dependent binary files to the storage account. The binary files include the program that is run by the task and the dependent assemblies. These files must also be accessed from storage and are loaded onto the TVM.
3. Create a pool of TVMs, specifying the size of the TVMs in the pool, the OS they run, and other properties. When a task runs, it is assigned a TVM from this pool.
4. Create a workitem. A job will be automatically created when you create a workitem. A workitem enables you to manage a job of tasks.
5. Add tasks to the job. Each task uses the program that you uploaded to process information from a file you uploaded.
6. Run the application and monitor the results of the output." [azure.microsoft.com/ en-us/ documentation/ articles/ batch-technical-overview/ ]
The diagram example "Workitems workflow diagram" was created using ConceptDraw PRO diagramming and vector drawing software extended with the Azure Architecture solution from the Computer and Networks area of ConceptDraw Solution Park.
"Workitems workflow.
Figure 4 shows a you how to submit an application to a pool where it's distributed for processing. This uses the Batch API. ...
1. Upload input files (such as source data or images) required for a job to an Azure storage account. These files must be in the storage account so that the Batch service can access them. The Batch service loads them onto a TVM when the task runs.
2. Upload the dependent binary files to the storage account. The binary files include the program that is run by the task and the dependent assemblies. These files must also be accessed from storage and are loaded onto the TVM.
3. Create a pool of TVMs, specifying the size of the TVMs in the pool, the OS they run, and other properties. When a task runs, it is assigned a TVM from this pool.
4. Create a workitem. A job will be automatically created when you create a workitem. A workitem enables you to manage a job of tasks.
5. Add tasks to the job. Each task uses the program that you uploaded to process information from a file you uploaded.
6. Run the application and monitor the results of the output." [azure.microsoft.com/ en-us/ documentation/ articles/ batch-technical-overview/ ]
The diagram example "Workitems workflow diagram" was created using ConceptDraw PRO diagramming and vector drawing software extended with the Azure Architecture solution from the Computer and Networks area of ConceptDraw Solution Park.
Cloud computing system architecture diagram
 ConceptDraw Solution Park
ConceptDraw Solution Park collects graphic extensions, examples and learning materials
This work flow chart sample was redesigned from the picture "Weather Forecast" from the article "Simulation Workflows".
[iaas.uni-stuttgart.de/ forschung/ projects/ simtech/ sim-workflows.php]
"(1) The weather is predicted for a particular geological area. Hence, the workflow is fed with a model of the geophysical environment of ground, air and water for a requested area.
(2) Over a specified period of time (e.g. 6 hours) several different variables are measured and observed. Ground stations, ships, airplanes, weather balloons, satellites and buoys measure the air pressure, air/ water temperature, wind velocity, air humidity, vertical temperature profiles, cloud velocity, rain fall, and more.
(3) This data needs to be collected from the different sources and stored for later access.
(4) The collected data is analyzed and transformed into a common format (e.g. Fahrenheit to Celsius scale). The normalized values are used to create the current state of the atmosphere.
(5) Then, a numerical weather forecast is made based on mathematical-physical models (e.g. GFS - Global Forecast System, UKMO - United Kingdom MOdel, GME - global model of Deutscher Wetterdienst). The environmental area needs to be discretized beforehand using grid cells. The physical parameters measured in Step 2 are exposed in 3D space as timely function. This leads to a system of partial differential equations reflecting the physical relations that is solved numerically.
(6) The results of the numerical models are complemented with a statistical interpretation (e.g. with MOS - Model-Output-Statistics). That means the forecast result of the numerical models is compared to statistical weather data. Known forecast failures are corrected.
(7) The numerical post-processing is done with DMO (Direct Model Output): the numerical results are interpolated for specific geological locations.
(8) Additionally, a statistical post-processing step removes failures of measuring devices (e.g. using KALMAN filters).
(9) The statistical interpretation and the numerical results are then observed and interpreted by meteorologists based on their subjective experiences.
(10) Finally, the weather forecast is visualized and presented to interested people." [iaas.uni-stuttgart.de/ forschung/ projects/ simtech/ sim-workflows.php]
The example "Workflow diagram - Weather forecast" was drawn using the ConceptDraw PRO diagramming and vector drawing software extended with the Workflow Diagrams solution from the Business Processes area of ConceptDraw Solution Park.
Work flow chart

 Cloud Computing Diagrams
The Cloud Computing Diagrams solution extends the functionality of the ConceptDraw PRO software with comprehensive collection of libraries of cloud computing vector stencils to help you get started design of Cloud Computing Diagrams and Architecture D
 Workflow Diagrams
Workflow Diagrams solution extends ConceptDraw PRO software with samples, templates and vector stencils library for drawing the work process flowcharts.
 Scrum Workflow
The Scrum Workflow Solution extends the capabilities of ConceptDraw PRO 10 with a large collection of professionally-designed samples and a selection of ready-to-use scrum design elements: scrum diagrams and arrows, scrum icons of people, artifacts, workflow, workspace and other colorful scrum clipart, and also scrum charts.
 Azure Architecture
Azure Architecture solution bundles into one handy tool everything you need to create effective Azure Architecture diagrams. It adds the extra value to versatile ConceptDraw PRO software and extends the users capabilities with comprehensive collection of Microsoft Azure themed graphics, logos, preset templates, wide array of predesigned vector symbols that covers the subjects such as Azure management, Azure storage, and Azure services, amongst others, and allow you to illustrate Azure Architecture diagrams at any degree of complexity, to present visually your Azure cloud system architecture with professional style, to design Azure cloud topology, to document Windows Azure Architecture and Azure Cloud System Architecture, to visualize the great abilities and work of Microsoft Azure Cloud System and Azure services.
HelpDesk
How to Create an Azure Architecture Diagram Using ConceptDraw PRO

HelpDesk
How to Create a Workflow Diagram Using ConceptDraw Solution Park

HelpDesk
How to Create a Cloud Computing Diagram Using ConceptDraw PRO

- Cloud Workflow Software
- Step chart - Cloud testing steps | Workitems workflow diagram | ER ...
- Microsoft Azure StorSimple architecture | Workitems workflow ...
- UML Diagram | Computer Network Diagrams | AWS 2.3 Architecture ...
- Azure Storage | Workitems workflow diagram | Microsoft Azure ...
- Workitems workflow diagram | How to Use the Effort-Driven ...
- Web Service Workflow Sample
- Workitems workflow diagram
- Workitems workflow diagram | Basic Flowchart Symbols and ...
- How To Diagram Workflow Process Web Services
- Entity Relationship Diagram Symbols and Meaning ERD Symbols ...
- Web Application Workflow Diagram
- Step chart - Template | Step chart - Cloud testing steps | Step chart ...
- Agile Methodology | Scrum Workflow | Agile Extreme Programming
- AWS Architecture Diagrams | Azure Storage | Cloud Computing ...
- Information Technology Architecture | Cloud Computing Architecture ...
- Workflow Application | How To Convert a Workflow Diagram to ...
- Er Diagram Practice Problems With Solutions
- Components of ER Diagram | Process Flowchart | Workflow ...