This Water cycle diagram example was drawn using the ConceptDraw PRO diagramming and vector graphics software extended with the clipart libraries Geography and Weather.
"The water cycle, also known as the hydrologic cycle or the H2O cycle, describes the continuous movement of water on, above and below the surface of the Earth. The mass water on Earth remains fairly constant over time but the partitioning of the water into the major reservoirs of ice, fresh water, saline water and atmospheric water is variable depending on a wide range of climatic variables. The water moves from one reservoir to another, such as from river to ocean, or from the ocean to the atmosphere, by the physical processes of evaporation, condensation, precipitation, infiltration, runoff, and subsurface flow. In so doing, the water goes through different phases: liquid, solid (ice), and gas (vapor)." [Water cycle. Wikipedia]
This water cycle diagram example is included in the Nature solution from the Illustration area of ConceptDraw Solution Park.
Vector illustration

 ConceptDraw Solution Park
ConceptDraw Solution Park collects graphic extensions, examples and learning materials
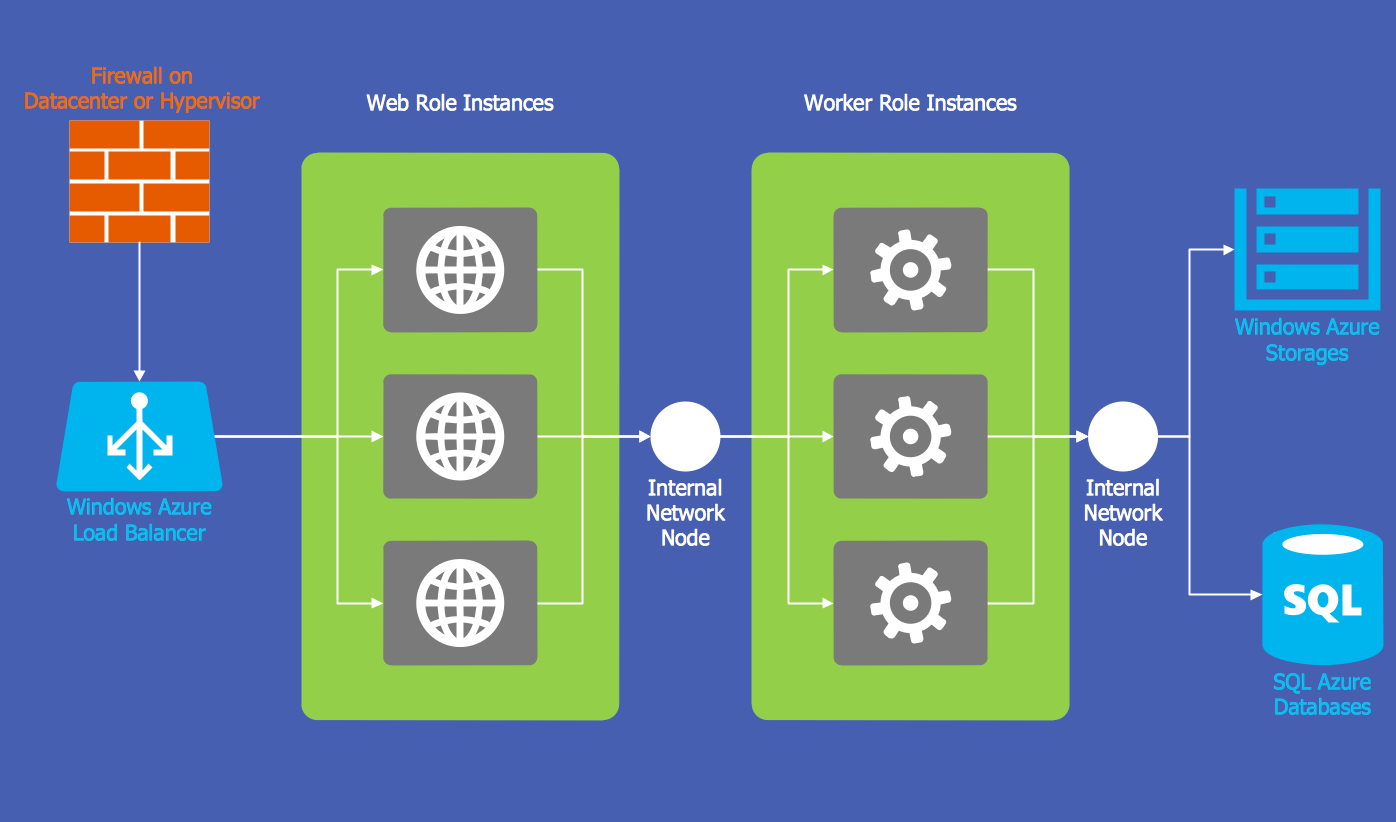
This example of cloud computing system architecture diagram was created on the base of picture in the post "Sending Windows 8 Push Notifications using Windows Azure Mobile Services" from the Nick Harris .NET blog.
"The goal of Windows Azure Mobile Services is to make it incredibly easy for developers to add a cloud backend to their client apps be it a Windows 8, Windows Phone, iOS or Android application. ... Mobile Services today provides:
- Structured Storage
- Server Logic ...
- Auth ...
- Push Notifications ...
- Common tenants of Windows Azure Services
- Scale ...
- Diagnostics ...
- Logging ...
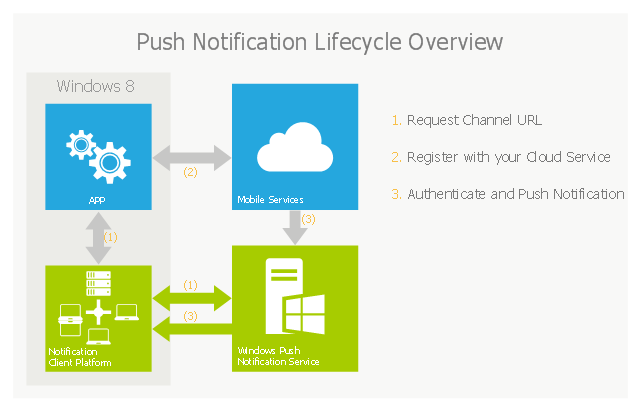
What are Push Notifications?
The Windows Push Notification Services (WNS) enables you to send toast, tile, badge and raw notifications from the cloud to your Windows Store applications even when your app is not running. Push notifications are ideal for scenarios when you need to target a specific user with personalized content.
The following diagram depicts the general Lifecycle of a push notifications via the Windows Azure Notification Service (WNS). We’ll walk through the steps shortly but before doing so I thought it would be important to call out that as a developer implementing a push notification scenario all you need to do is implement those interactions in grey and the applications/ services in blue." [nickharris.net/ index.php/ 2012/ 10/ 04/ blog-series-sending-windows-8-push-notifications-using-windows-azure-mobile-services/ ]
The diagram example "Push Notification Lifecycle Overview" was created using ConceptDraw PRO diagramming and vector drawing software extended with the Azure Architecture solution from the Computer and Networks area of ConceptDraw Solution Park.
"The goal of Windows Azure Mobile Services is to make it incredibly easy for developers to add a cloud backend to their client apps be it a Windows 8, Windows Phone, iOS or Android application. ... Mobile Services today provides:
- Structured Storage
- Server Logic ...
- Auth ...
- Push Notifications ...
- Common tenants of Windows Azure Services
- Scale ...
- Diagnostics ...
- Logging ...
What are Push Notifications?
The Windows Push Notification Services (WNS) enables you to send toast, tile, badge and raw notifications from the cloud to your Windows Store applications even when your app is not running. Push notifications are ideal for scenarios when you need to target a specific user with personalized content.
The following diagram depicts the general Lifecycle of a push notifications via the Windows Azure Notification Service (WNS). We’ll walk through the steps shortly but before doing so I thought it would be important to call out that as a developer implementing a push notification scenario all you need to do is implement those interactions in grey and the applications/ services in blue." [nickharris.net/ index.php/ 2012/ 10/ 04/ blog-series-sending-windows-8-push-notifications-using-windows-azure-mobile-services/ ]
The diagram example "Push Notification Lifecycle Overview" was created using ConceptDraw PRO diagramming and vector drawing software extended with the Azure Architecture solution from the Computer and Networks area of ConceptDraw Solution Park.
Cloud computing system architecture diagram
Flow Chart Creator
 Target and Circular Diagrams
This solution extends ConceptDraw DIAGRAM software with samples, templates and library of design elements for drawing the Target and Circular Diagrams.
JSD - Jackson system development

 Basic Circular Arrows Diagrams
This solution extends ConceptDraw DIAGRAM (or later) with samples, templates, and a library of vector stencils for drawing circular arrow diagrams.
Windows Azure
SWOT Matrix

 Circular Arrows Diagrams
Circular Arrows Diagrams solution extends ConceptDraw DIAGRAM with extensive drawing tools, predesigned samples, Circular flow diagram template for quick start, and a library of ready circular arrow vector stencils for drawing Circular Arrow Diagrams, Segmented Cycle Diagrams, and Circular Flow Diagrams. The elements in this solution help managers, analysts, business advisers, marketing experts, scientists, lecturers, and other knowledge workers in their daily work.
How to Build a Flowchart
Network Topologies


Draw Flowcharts with ConceptDraw

 Business Process Workflow Diagrams
The Business Process Workflow Diagrams solution enhances the ConceptDraw DIAGRAM functionality with predesigned examples, samples and a numerous collection of predesigned vector objects of workflow chart elements, icons, arrows, connectors, and varied wor
HelpDesk
How to Draw a Circular Arrows Diagram

- Water cycle diagram | Push Notification Lifecycle Overview | Flow ...
- Cloud Computing Diagrams | ConceptDraw Solution Park | How to ...
- Water cycle diagram | Nature | ConceptDraw Solution Park | Cloud ...
- Water cycle diagram | Sea With Cloud Clip Art
- Water cycle diagram | Weather - Vector stencils library | Rain And ...
- Water cycle diagram | Workflow diagram - Weather forecast ...
- How to Build Cloud Computing Diagram Principal Cloud ...
- How to Build Cloud Computing Diagram Principal Cloud ...
- Weather - Vector stencils library | Water cycle diagram | Weather ...
- CERES data flow diagram | Water cycle diagram | Bar Diagrams for ...
- Target market | Competitor Analysis | Cloud marketing diagram ...
- Water cycle diagram | Drawing a Nature Scene | Drawing Illustration ...
- Draw Energy Cloud Diagram
- Cloud Services Overview
- Product Life Cycle Management Diagram
- Water cycle diagram | Workflow diagram - Weather forecast | Bar ...
- Amazon Cloud Computing Architecture | ConceptDraw Solution ...
- Water cycle diagram | Drawing Illustration | Nature Clipart and ...
- Life Cycle Diagram With Visio
- Network Security Diagrams | Introduction to Cloud Computing ...