Cloud Computing
Cloud Computing Architecture Diagrams

This Azure cloud architecture pattern diagram template was created on the base of figure in the article "External Configuration Store Pattern" from the Microsoft Developer Network (MSDN) website.
"External Configuration Store Pattern.
Move configuration information out of the application deployment package to a centralized location. This pattern can provide opportunities for easier management and control of configuration data, and for sharing configuration data across applications and application instances. ...
The majority of application runtime environments include configuration information that is held in files deployed with the application, located within the application folders. In some cases it is possible to edit these files to change the behavior of the application after it has been deployed. However, in many cases, changes to the configuration require the application to be redeployed, resulting in unacceptable downtime and additional administrative overhead. ...
Store the configuration information in external storage, and provide an interface that can be used to quickly and efficiently read and update configuration settings. The type of external store depends on the hosting and runtime environment of the application. In a cloud-hosted scenario it is typically a cloud-based storage service, but could be a hosted database or other system.
The backing store chosen for configuration information should be fronted by a suitable interface that provides consistent and easy to use access in a controlled way that enables reuse. Ideally, it should expose the information in a correctly typed and structured format. The implementation may also need to authorize users’ access in order to protect configuration data, and be flexible enough to allow multiple versions of the configuration (such as development, staging, or production, and multiple release versions of each one) to be stored." [msdn.microsoft.com/ ru-RU/ library/ dn589803.aspx]
The Azure cloud system architecture diagram template "External Configuration Store Pattern" for the ConceptDraw PRO diagramming and vector drawing software is included in the Azure Architecture solutin from the Computer and Networks area of ConceptDraw Solution Park.
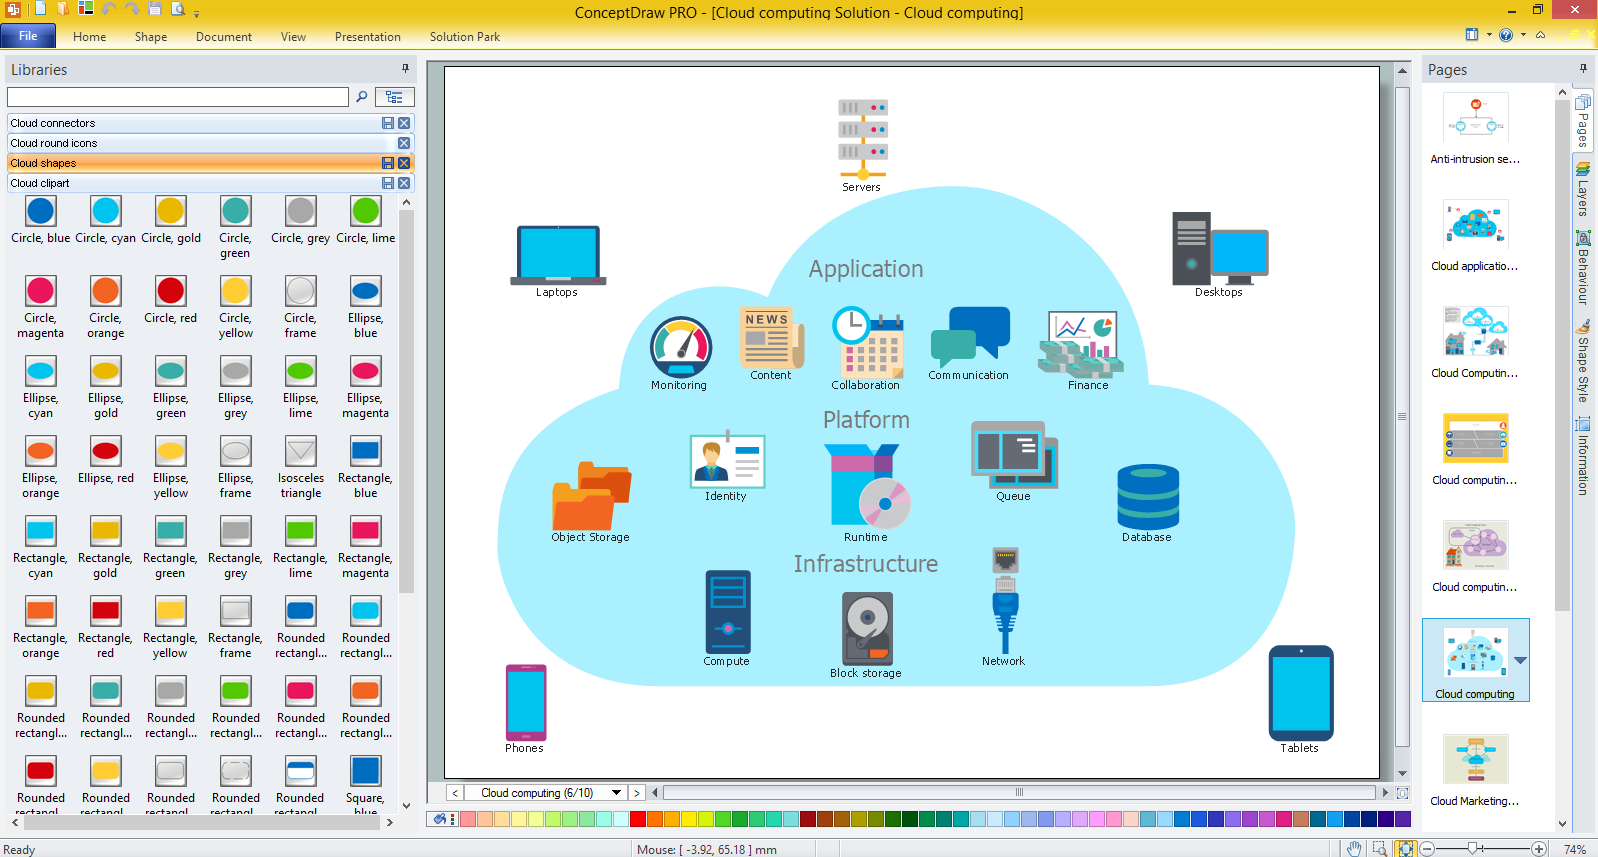
Cloud computing system architecture diagram template

What is Cloud Computing
"There are two definitions for wireless LAN roaming:
Internal Roaming (1): The Mobile Station (MS) moves from one access point (AP) to another AP within a home network because the signal strength is too weak. An authentication server (RADIUS) performs the re-authentication of MS via 802.1x (e.g. with PEAP). The billing of QoS is in the home network. A Mobile Station roaming from one access point to another often interrupts the flow of data among the Mobile Station and an application connected to the network. The Mobile Station, for instance, periodically monitors the presence of alternative access points (ones that will provide a better connection). At some point, based on proprietary mechanisms, the Mobile Station decides to re-associate with an access point having a stronger wireless signal. The Mobile Station, however, may lose a connection with an access point before associating with another access point. In order to provide reliable connections with applications, the Mobile Station must generally include software that provides session persistence.
External Roaming (2): The MS (client) moves into a WLAN of another Wireless Internet Service Provider (WISP) and takes their services (Hotspot). The user can independently of his home network use another foreign network, if this is open for visitors. There must be special authentication and billing systems for mobile services in a foreign network." [Wireless LAN. Wikipedia]
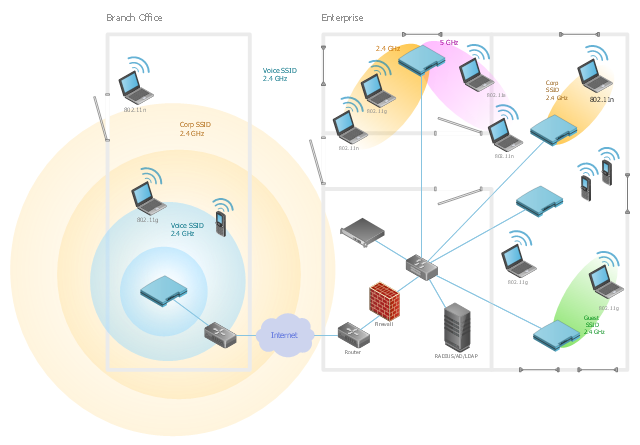
This Cisco roaming wireless local area network diagram example was created using the ConceptDraw PRO diagramming and vector drawing software extended with the Cisco Network Diagrams solution from the Computer and Networks area of ConceptDraw Solution Park.
Internal Roaming (1): The Mobile Station (MS) moves from one access point (AP) to another AP within a home network because the signal strength is too weak. An authentication server (RADIUS) performs the re-authentication of MS via 802.1x (e.g. with PEAP). The billing of QoS is in the home network. A Mobile Station roaming from one access point to another often interrupts the flow of data among the Mobile Station and an application connected to the network. The Mobile Station, for instance, periodically monitors the presence of alternative access points (ones that will provide a better connection). At some point, based on proprietary mechanisms, the Mobile Station decides to re-associate with an access point having a stronger wireless signal. The Mobile Station, however, may lose a connection with an access point before associating with another access point. In order to provide reliable connections with applications, the Mobile Station must generally include software that provides session persistence.
External Roaming (2): The MS (client) moves into a WLAN of another Wireless Internet Service Provider (WISP) and takes their services (Hotspot). The user can independently of his home network use another foreign network, if this is open for visitors. There must be special authentication and billing systems for mobile services in a foreign network." [Wireless LAN. Wikipedia]
This Cisco roaming wireless local area network diagram example was created using the ConceptDraw PRO diagramming and vector drawing software extended with the Cisco Network Diagrams solution from the Computer and Networks area of ConceptDraw Solution Park.
WLAN diagram

Used Solutions
HelpDesk
How to Create a CCTV Diagram

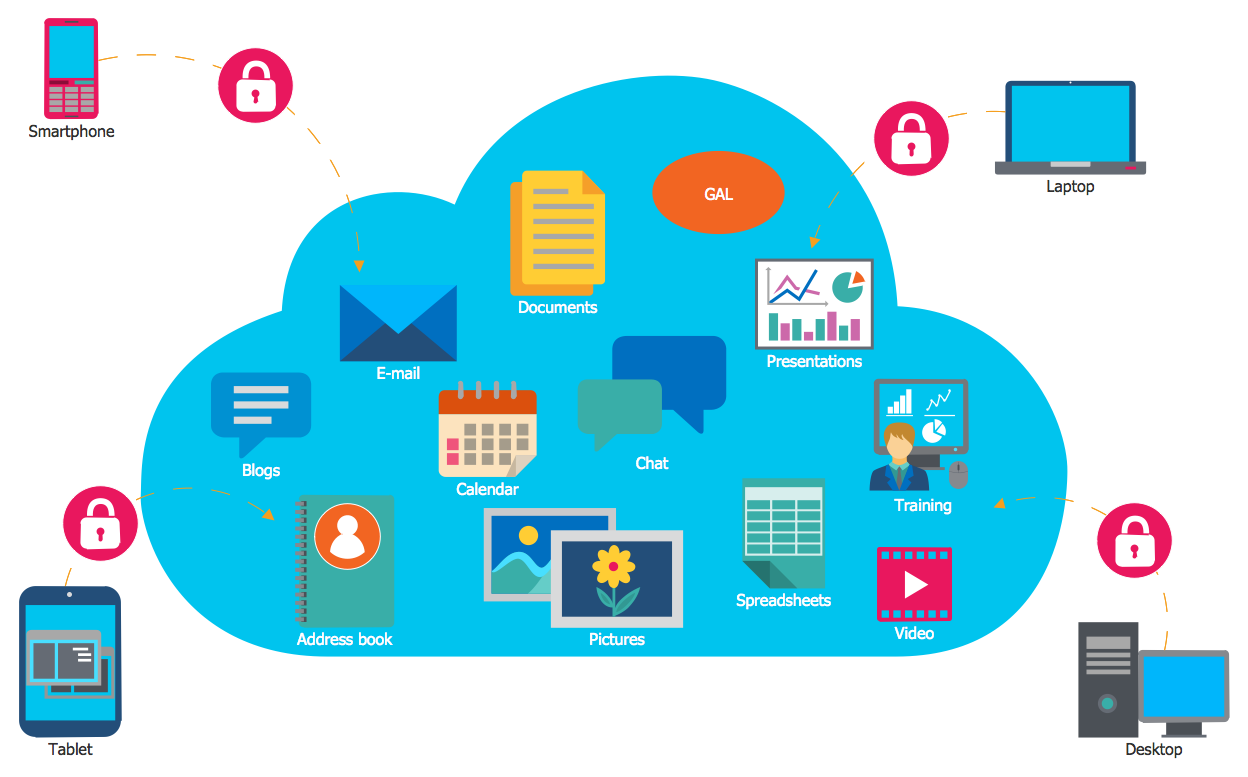
The vector stencils library "Cloud clipart" contains 195 icons.
Use it to design your cloud computing infographics and diagrams with ConceptDraw PRO software.
"Cloud computing, also known as 'on-demand computing', is a kind of Internet-based computing, where shared resources, data and information are provided to computers and other devices on-demand. It is a model for enabling ubiquitous, on-demand access to a shared pool of configurable computing resources. Cloud computing and storage solutions provide users and enterprises with various capabilities to store and process their data in third-party data centers. It relies on sharing of resources to achieve coherence and economies of scale..." [Cloud computing. Wikipedia]
The icon set example "Design elements - Cloud clipart" is included in the Cloud Computing Diagrams solution from the Computer and Networks area from ConceptDraw Solution Park.
Cloud computing icons
 ConceptDraw Solution Park
ConceptDraw Solution Park collects graphic extensions, examples and learning materials
This wireless network diagram sample shows ultra high performance WLANs.
"A wireless local area network (WLAN) links two or more devices using some wireless distribution method (typically spread-spectrum or OFDM radio), and usually providing a connection through an access point to the wider Internet. This gives users the ability to move around within a local coverage area and still be connected to the network. Most modern WLANs are based on IEEE 802.11 standards, marketed under the Wi-Fi brand name. WLANs were once called LAWNs (for local area wireless network) by the Department of Defense." [Wireless LAN. Wikipedia]
The wireless network diagram example "Ultra high performance WLANs" was created using the ConceptDraw PRO diagramming and vector drawing software extended with the Wireless Networks solution from the Computer and Networks area of ConceptDraw Solution Park.
Wireless network diagram
Network Glossary Definition


"A wireless local area network (WLAN) links two or more devices using some wireless distribution method (typically spread-spectrum or OFDM radio), and usually providing a connection through an access point to the wider Internet. This gives users the ability to move around within a local coverage area and still be connected to the network. Most modern WLANs are based on IEEE 802.11 standards, marketed under the Wi-Fi brand name. WLANs were once called LAWNs (for local area wireless network) by the Department of Defense." [Wireless LAN. Wikipedia]
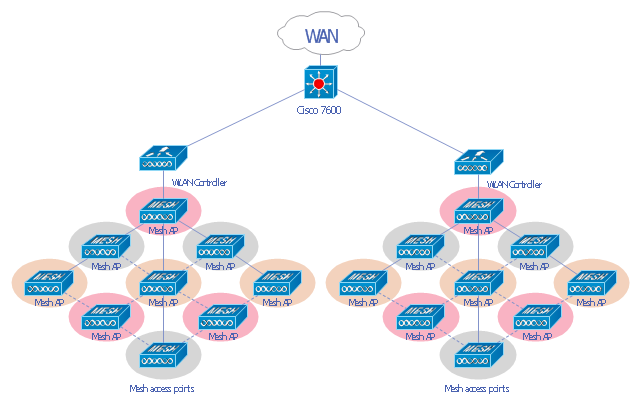
This Cisco wireless mesh network diagram example was created using the ConceptDraw PRO diagramming and vector drawing software extended with the Cisco Network Diagrams solution from the Computer and Networks area of ConceptDraw Solution Park.
This Cisco wireless mesh network diagram example was created using the ConceptDraw PRO diagramming and vector drawing software extended with the Cisco Network Diagrams solution from the Computer and Networks area of ConceptDraw Solution Park.
WLAN diagram
This work flow chart sample was redesigned from the picture "Weather Forecast" from the article "Simulation Workflows".
[iaas.uni-stuttgart.de/ forschung/ projects/ simtech/ sim-workflows.php]
"(1) The weather is predicted for a particular geological area. Hence, the workflow is fed with a model of the geophysical environment of ground, air and water for a requested area.
(2) Over a specified period of time (e.g. 6 hours) several different variables are measured and observed. Ground stations, ships, airplanes, weather balloons, satellites and buoys measure the air pressure, air/ water temperature, wind velocity, air humidity, vertical temperature profiles, cloud velocity, rain fall, and more.
(3) This data needs to be collected from the different sources and stored for later access.
(4) The collected data is analyzed and transformed into a common format (e.g. Fahrenheit to Celsius scale). The normalized values are used to create the current state of the atmosphere.
(5) Then, a numerical weather forecast is made based on mathematical-physical models (e.g. GFS - Global Forecast System, UKMO - United Kingdom MOdel, GME - global model of Deutscher Wetterdienst). The environmental area needs to be discretized beforehand using grid cells. The physical parameters measured in Step 2 are exposed in 3D space as timely function. This leads to a system of partial differential equations reflecting the physical relations that is solved numerically.
(6) The results of the numerical models are complemented with a statistical interpretation (e.g. with MOS - Model-Output-Statistics). That means the forecast result of the numerical models is compared to statistical weather data. Known forecast failures are corrected.
(7) The numerical post-processing is done with DMO (Direct Model Output): the numerical results are interpolated for specific geological locations.
(8) Additionally, a statistical post-processing step removes failures of measuring devices (e.g. using KALMAN filters).
(9) The statistical interpretation and the numerical results are then observed and interpreted by meteorologists based on their subjective experiences.
(10) Finally, the weather forecast is visualized and presented to interested people." [iaas.uni-stuttgart.de/ forschung/ projects/ simtech/ sim-workflows.php]
The example "Workflow diagram - Weather forecast" was drawn using the ConceptDraw PRO diagramming and vector drawing software extended with the Workflow Diagrams solution from the Business Processes area of ConceptDraw Solution Park.
Work flow chart

- Cloud Computing. Computer and Network Examples | Roaming ...
- Cloud Computing | Cloud Computing Architecture | Valet key pattern ...
- Hotel Network Topology Diagram. Hotel Guesthouse WiFi Network ...
- Wireless access point - Network diagram | Roaming wireless local ...
- What Is Cloud Based Computing
- Cloud Computing Diagrams | Cloud Computing Architecture ...
- Cloud Based Applications
- Cloud Computing Diagrams | Cloud Computing | How to Create a ...
- Mobile satellite communication network diagram | Hybrid satellite ...
- Azure Management | How to Create an Azure Architecture Diagram ...
- Computer network system design diagram | Network Diagramming ...
- Introduction to Cloud Computing Architecture | Cloud Computing ...
- How to Create a Cloud Computing Diagram Using ConceptDraw ...
- Hybrid satellite and common carrier network diagram | Satellite ...
- Cloud Based Computer
- Cloud Computing Diagrams | Introduction to Cloud Computing ...
- Cloud Computing Diagrams | Cloud Computing Architecture ...
- Physical LAN and WAN diagram - Template | Wireless broadband ...
- Cloud round icons - Vector stencils library | Push Notification ...
- Cloud Computing | What is Cloud Computing | How to Create a ...