HelpDesk
How to Create a Bank ATM Use Case Diagram Using ConceptDraw PRO

ConceptDraw PRO diagramming software, enhanced and expanded with the ATM UML Diagrams solution, offers the full range of icons, templates and design elements needed to faithfully represent ATM and banking information system architecture using UML standards. The ATM UML Diagrams solution is useful for beginner and advanced users alike. More experienced users will appreciate a full range of vector stencil libraries and ConceptDraw PRO's powerful software, that allows you to create your ATM UML diagram in a matter of moments.
 Business Process Diagrams
The Business Process Diagram Solution extends ConceptDraw PRO v10 BPMN software with its RapidDraw interface, templates, samples, and libraries based on the BPMN 1.2 and BPMN 2.0 standards. This powerful solution permits you to visualize easily both simple and complex processes, as well as design business models. The Business Process Diagram solution allows one to quickly develop and document in detail any business processes at any stage of a project’s planning and implementation.
HelpDesk
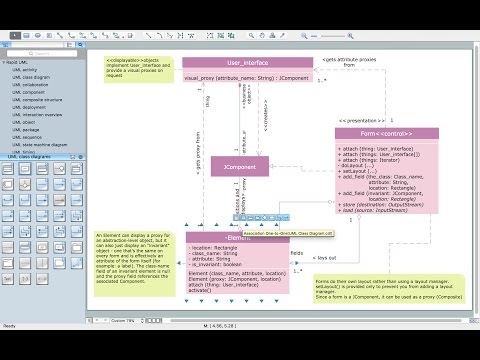
How to Make a UML Diagram in ConceptDraw PRO

Using UML during the modeling process has a number of benefits — for one, the entire development team can share information and collaborate using common language, diagrams and software, something that's not possible when using a more task-specific programming language.
It allows team members to create system 'blueprin
 Fishbone Diagrams
The Fishbone Diagrams solution extends ConceptDraw PRO v10 software with the ability to easily draw the Fishbone Diagrams (Ishikawa Diagrams) to clearly see the cause and effect analysis and also problem solving. The vector graphic diagrams produced using this solution can be used in whitepapers, presentations, datasheets, posters, and published technical material.
 Entity-Relationship Diagram (ERD)
Entity-Relationship Diagram (ERD) solution extends ConceptDraw PRO software with templates, samples and libraries of vector stencils from drawing the ER-diagrams by Chen's and crow’s foot notations.
 Fishbone Diagram
Fishbone Diagrams solution extends ConceptDraw PRO software with templates, samples and library of vector stencils for drawing the Ishikawa diagrams for cause and effect analysis.
 Rapid UML
Rapid UML solution extends ConceptDraw PRO software with templates, samples and libraries of vector stencils for quick drawing the UML diagrams using Rapid Draw technology.
 Audio, Video, Media
This solution extends ConceptDraw PRO software with samples, templates and library of vector clipart of audio, media, video and photo equipment for drawing the illustrations.
 Data Flow Diagrams (DFD)
Data Flow Diagrams solution extends ConceptDraw PRO software with templates, samples and libraries of vector stencils for drawing the data flow diagrams (DFD).
 Rapid UML
Rapid UML solution extends ConceptDraw PRO software with templates, samples and libraries of vector stencils for quick drawing the UML diagrams using Rapid Draw technology.
 Audit Flowcharts
Audit flowcharts solution extends ConceptDraw PRO software with templates, samples and library of vector stencils for drawing the audit and fiscal flow charts.
 Fault Tree Analysis Diagrams
This solution extends ConceptDraw PRO v9.5 or later with templates, fault tree analysis example, samples and a library of vector design elements for drawing FTA diagrams (or negative analytical trees), cause and effect diagrams and fault tree diagrams.
 Event-driven Process Chain Diagrams
Event-driven Process Chain (EPC) Diagram is a type of flowchart widely used for modeling in business engineering and reengineering, business process improvement, and analysis. EPC method was developed within the Architecture of Integrated Information Systems (ARIS) framework.
- UML sequence diagram - Help desk | UML Use Case Diagrams ...
- UML Component Diagram Example - Online Shopping | Enterprise ...
- Data Flow Diagram
- State Diagram Example - Online Store | Example of DFD for Online ...
- How to Create a Bank ATM Use Case Diagram Using ConceptDraw ...
- Sequence Diagram For Online Tutorial
- UML Deployment Diagram Example - ATM System | UML Class ...
- UML Sequence Diagram Example. SVG Vectored UML Diagrams ...
- UML Use Case Diagram Example Registration System
- UML Class Diagram Tutorial | How to Create an IDEF0 Diagram for ...
- How to Create a Data Flow Diagram using ConceptDraw PRO | Data ...
- UML Class Diagram Example - Social Networking Site | ATM UML ...
- Class Diagram Uml Template
- How to Create a Social Media DFD Flowchart | Business Diagram ...
- Online Medical Store Use Case Project With Object Model Diagram
- UML Tool & UML Diagram Examples
- UML Class Diagram Example - Medical Shop | UML Notation | How ...
- UML Class Diagram Example - Medical Shop | UML Tool & UML ...
- UML Component Diagram Example - Online Shopping | State ...
- UML Class Diagrams . Diagramming Software for Design UML ...