 Basic Circle-Spoke Diagrams
Basic circle-spoke diagrams are well suited for marketing, management documents, and presentations.
 Basic Circular Arrows Diagrams
This solution extends ConceptDraw PRO v10 (or later) with samples, templates, and a library of vector stencils for drawing circular arrow diagrams.
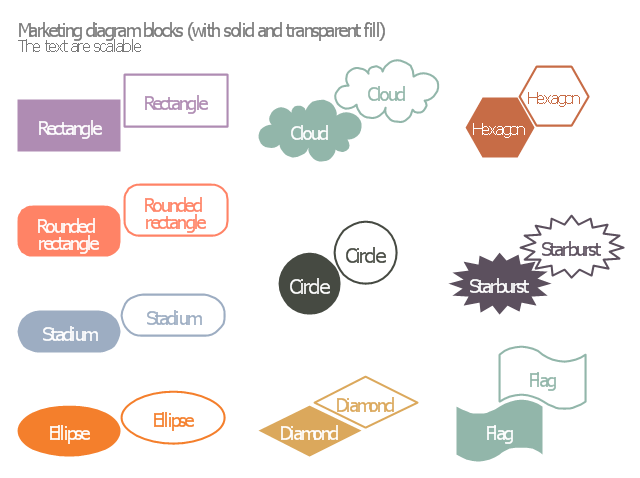
The vector stencils library "Marketing diagram" contains 20 solid and transparent geometric shapes: rectangle, rounded rectangle, ellipse, cloud, circle, diamond, hexagon, starburst, flag.
Use it to illustrate your marketing infograms with block diagrams.
"The term diagram in its commonly used sense can have a general or specific meaning:
(1) visual information device: Like the term "illustration" the diagram is used as a collective term standing for the whole class of technical genres, including graphs, technical drawings and tables.
(2) specific kind of visual display: This is the genre that shows qualitative data with shapes that are connected by lines, arrows, or other visual links. ...
In the specific sense diagrams and charts contrast with computer graphics, technical illustrations, infographics, maps, and technical drawings, by showing "abstract rather than literal representations of information". The essence of a diagram can be seen as:
(1) a form of visual formatting devices;
(2) a display that does not show quantitative data (numerical data), but rather relationships and abstract information;
(3) with building blocks such as geometrical shapes connected by lines, arrows, or other visual links." [Diagram. Wikipedia]
The shapes example "Design elements - Marketing diagram" was created using the ConceptDraw PRO diagramming and vector drawing software extended with the Marketing Infographics solition from the area "Business Infographics" in ConceptDraw Solution Park.
Diagram building blocks
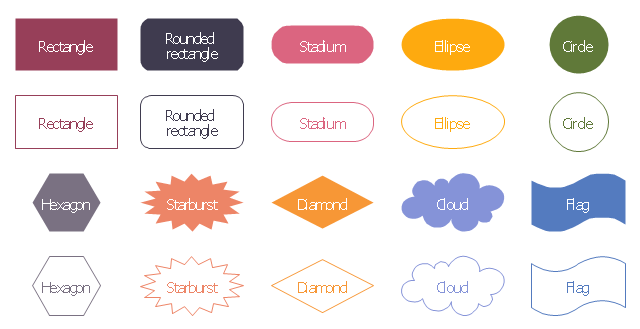
The vector stencils library "Education diagram" contains 20 solid and transparent geometric shapes: rectangle, rounded rectangle, ellipse, cloud, circle, diamond, hexagon, starburst, flag.
Use it to illustrate your education infograms with block diagrams.
"A diagram is a two-dimensional geometric (can be three-dimensional also) symbolic representation of information according to some visualization technique. They have been used since ancient times but became more prevalent during the Enlightenment. Sometimes, the technique uses a three-dimensional visualization which is then projected onto the two-dimensional surface. The word graph is sometimes used as a synonym for diagram." [Diagram. Wikipedia]
The geometric shapes example "Design elements - Education diagram" was created using the ConceptDraw PRO diagramming and vector drawing software extended with the Education Infographics solition from the area "Business Infographics" in ConceptDraw Solution Park.
Diagram blocks
Basic Flowchart Symbols and Meaning


 Stakeholder Onion Diagrams
The Stakeholder Onion Diagram is often used as a way to view the relationships of stakeholders to a project goal. A basic Onion Diagram contains a rich information. It shows significance of stakeholders that will have has influence to the success achieve
 Plan-Do-Check-Act (PDCA)
Plan-Do-Check-Act (PDCA) solution extends the ConceptDraw PRO software with collection of samples and predesigned vector objects for easy visualization four stages of PDCA cycle, PDSA cycle, or Deming cycle, for illustration effective application of this method to the practical business tasks, for depiction the implementation of changes and solution the problems in business processes. Plan-Do-Check-Act (PDCA) solution helps to design professional-looking and attractive Plan Do Study Act diagrams, PDCA cycle diagrams, PDCA Process diagrams, and to construct the Quality Management Process Models, which all assist to manage efficiently the business processes, to improve quality of work and to reduce significantly the costs.
 Current Activities Reports
The Current Activities Reports solution extends abilities of project management software ConceptDraw PROJECT in high-quality planning and managing projects. It delivers the capability to generate the Completed Tasks, Critical Tasks, Tasks in Progress, Unstarted Tasks, and Overdue Tasks reports, which help to reflect clearly the actual situation in a project, the tasks statuses, the project cost at the moment, to compare the planned amount of work to the actually performed one. The set of professionally developed examples also included to this management solution, will help you to explore all power of this solution and to experiment with its variety of reports in a spreadsheet format, which perfectly suit for demonstrating at the regular meetings with members of project team and for the meetings with the company's executives, at this your report will look exceptionally both in electronic and printable view.
 Diagrams Area
Solutions of the area Diagrams from ConceptDraw Solution Park collect templates, samples and vector stencils libraries for drawing diagrams visualizing qualitative information and knowledge.
 Landscape & Garden
The Landscape and Gardens solution for ConceptDraw PRO v10 is the ideal drawing tool when creating landscape plans. Any gardener wondering how to design a garden can find the most effective way with Landscape and Gardens solution.
- Half Circle Arrow Transparent
- White Circle Png Transparent
- Transparent Circle Png
- Constellations Transparent Background Png
- Arrows - Vector clipart library | Circular Arrows Diagrams | Arrows ...
- Circular diagrams - Vector stencils library | Flowchart design ...
- Simple Tool To Make Transparent Png
- Transparent Chart Images
- What Does Rectangle Circle Means In Block Diagram
- Circle Arrow Png