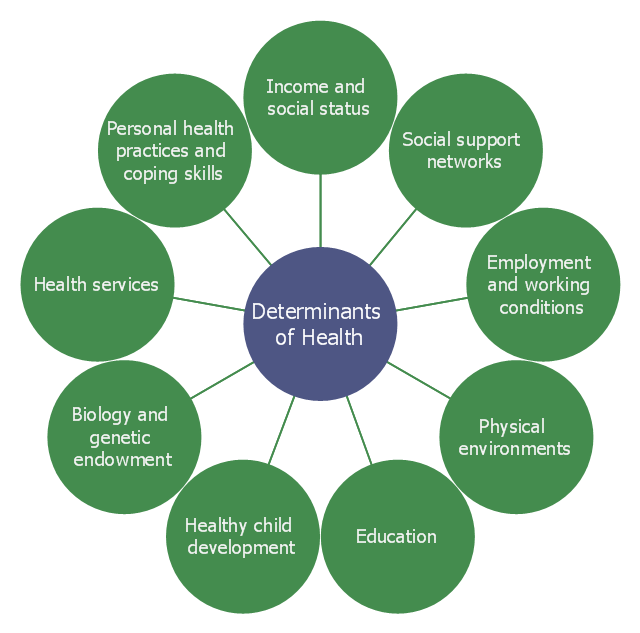
This example was created on the base of the hub-and-spoke diagram from the Health Canada website. [hc-sc.gc.ca/ sr-sr/ pubs/ hpr-rpms/ bull/ 2005-climat/ 2005-climat-6-eng.php]
"Social determinants of health are the economic and social conditions – and their distribution among the population – that influence individual and group differences in health status. They are risk factors found in one's living and working conditions (such as the distribution of income, wealth, influence, and power), rather than individual factors (such as behavioural risk factors or genetics) that influence the risk for a disease, or vulnerability to disease or injury. According to some viewpoints, these distributions of social determinants are shaped by public policies that reflect the influence of prevailing political ideologies of those governing a jurisdiction. ...
In 2003, the World Health Organization (WHO) Europe suggested that the social determinants of health included:
(1) Social gradients (life expectancy is shorter and disease is more common further down the social ladder).
(2) Stress (including stress in the workplace).
(3) Early childhood development.
(4) Social exclusion.
(5) Unemployment.
(6) Social support networks.
(7) Addiction.
(8) Availability of healthy food.
(9) Availability of healthy transportation." [Social determinants of health. Wikipedia]
The hub-and-spoke diagram example "Social determinants of health" was created using the ConceptDraw PRO diagramming and vector drawing software extended with the Circle-Spoke Diagrams solution from the area "What is a Diagram" of ConceptDraw Solution Park.
Circle-spoke diagram
 Area Charts
Area Charts are used to display the cumulative totals over time using numbers or percentages; or to show trends over time among related attributes. The Area Chart is effective when comparing two or more quantities. Each series of data is typically represented with a different color, the use of color transparency in an object’s transparency shows overlapped areas and smaller areas hidden behind larger areas.
- Social determinants of health - Hub-and-spoke diagram | Circle ...
- Circle Spoke Diagram
- Circle -spoke diagram
- Social determinants of health - Hub-and-spoke diagram | Wireless ...
- Circle Spoke Diagram 4
- Social determinants of health - Hub-and-spoke diagram | Star ...
- Influence Diagram Software | Influence Diagram | Types of ...
- Social determinants of health - Hub-and-spoke diagram | Health ...
- Venn Diagram Examples for Problem Solving. Environmental Social ...
- Hub Diagram
- CORRECTIVE ACTIONS PLANNING. Risk Diagram (PDPC) | How ...
- Ladder of customer loyalty diagram | Design elements - Marketing ...
- Cisco Switches and Hubs. Cisco icons, shapes, stencils and symbols
- How To Create Risk Diagram (PDPC) | How to Manage Problem ...
- Registered unemployment rate in Europe (EU-27) - september 2010 ...
- Aerospace illustration template | Computer and Communications ...
- UML Class Diagram Example for Transport System
- Transport map template | Maps | Rail transport - Vector stencils ...
- Social Media Response | How to Create a Social Media DFD ...