Registered unemployment rate in Europe (EU-27) - september 2010. Data from Portal Euro-Indicators on EU Commission website (Eurostat). [epp.eurostat.ec.europa.eu/ portal/ page/ portal/ euroindicators/ peeis]
"Eurostat, the statistical office of the European Union, defines unemployed as those persons age 15 to 74 who are not working, have looked for work in the last four weeks, and ready to start work within two weeks, which conform to ILO standards. Both the actual count and rate of unemployment are reported. Statistical data are available by member state, for the European Union as a whole (EU27) as well as for the euro area (EA16). Eurostat also includes a long-term unemployment rate. This is defined as part of the unemployed who have been unemployed for an excess of 1 year.
The main source used is the European Union Labour Force Survey (EU-LFS). The EU-LFS collects data on all member states each quarter. For monthly calculations, national surveys or national registers from employment offices are used in conjunction with quarterly EU-LFS data. The exact calculation for individual countries, resulting in harmonized monthly data, depend on the availability of the data." [Unemployment. Wikipedia]
This example Registered unemployment rate in Europe (EU-27) - september 2010 was redesigned using ConceptDraw PRO diagramming and vector drawing software from the Wikipedia file: Unemployment European Union 2010M09.svg.
[en.wikipedia.org/ wiki/ File:Unemployment_ European_ Union_ 2010M09.svg]
This file is licensed under the Creative Commons Attribution-Share Alike 3.0 Unported license. [creativecommons.org/ licenses/ by-sa/ 3.0/ deed.en]
The example Registered unemployment rate in Europe (EU-27) - september 2010 is included in the Continent Map solution from Maps area of ConceptDraw Solution Park.
www.conceptdraw.com/ solution-park/ maps-continent
---september-2010.png--diagram-flowchart-example.png)
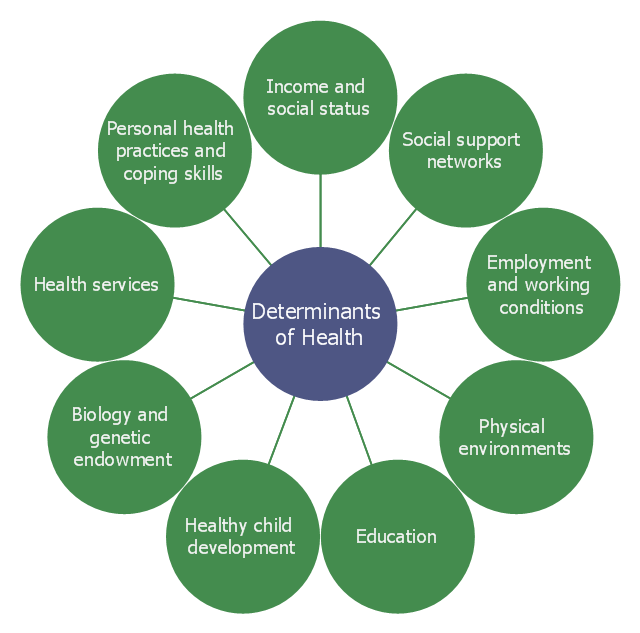
This example was created on the base of the hub-and-spoke diagram from the Health Canada website. [hc-sc.gc.ca/ sr-sr/ pubs/ hpr-rpms/ bull/ 2005-climat/ 2005-climat-6-eng.php]
"Social determinants of health are the economic and social conditions – and their distribution among the population – that influence individual and group differences in health status. They are risk factors found in one's living and working conditions (such as the distribution of income, wealth, influence, and power), rather than individual factors (such as behavioural risk factors or genetics) that influence the risk for a disease, or vulnerability to disease or injury. According to some viewpoints, these distributions of social determinants are shaped by public policies that reflect the influence of prevailing political ideologies of those governing a jurisdiction. ...
In 2003, the World Health Organization (WHO) Europe suggested that the social determinants of health included:
(1) Social gradients (life expectancy is shorter and disease is more common further down the social ladder).
(2) Stress (including stress in the workplace).
(3) Early childhood development.
(4) Social exclusion.
(5) Unemployment.
(6) Social support networks.
(7) Addiction.
(8) Availability of healthy food.
(9) Availability of healthy transportation." [Social determinants of health. Wikipedia]
The hub-and-spoke diagram example "Social determinants of health" was created using the ConceptDraw PRO diagramming and vector drawing software extended with the Circle-Spoke Diagrams solution from the area "What is a Diagram" of ConceptDraw Solution Park.
www.conceptdraw.com/ solution-park/ diagram-circle-spoke
Circle-spoke diagram
- Interior Design Registers, Drills and Diffusers - Design Elements ...
- EU 28: Candidate countries map | European membership of the EU ...
- Europe map template | Map Infographic Creator | European ...
- Political map of Europe | Tools to Create Your Own Infographics ...
- Social determinants of health - Hub-and-spoke diagram | Wireless ...
- Influence Diagram Software | Influence Diagram | Total Quality ...
- Influence Diagram | Influence Diagram Software | Types of Flowcharts |
- Cisco Switches and Hubs. Cisco icons, shapes, stencils and ...
- Circle-spoke diagram template
- Circle-spoke diagram template | Arrow circle chart template | Circle ...