Line Chart Template for Word

Chart Templates

Organizational Chart Templates


Pie Chart Word Template. Pie Chart Examples

Organizational Chart Template

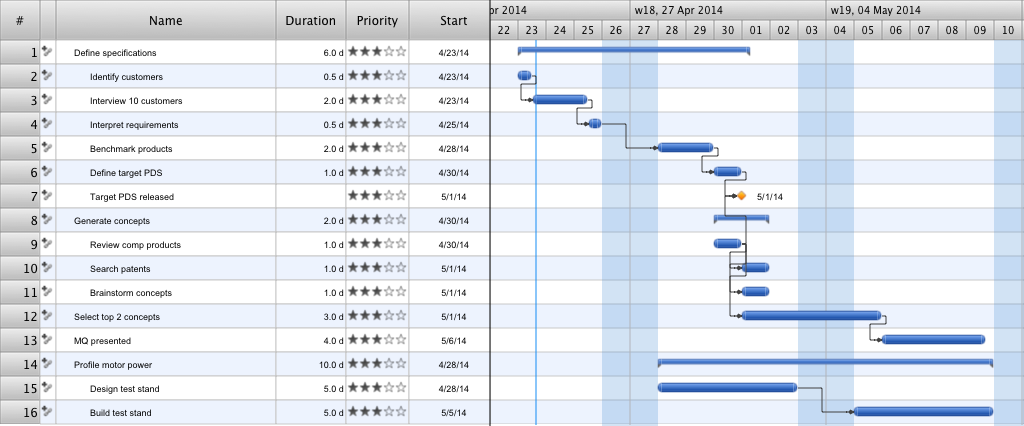
Gantt Chart Templates
Organization Chart Templates

Bar Chart Template for Word

Pie Chart Examples and Templates

Donut Chart Templates

Column Chart Template

Flowchart Software


Feature Comparison Chart Software

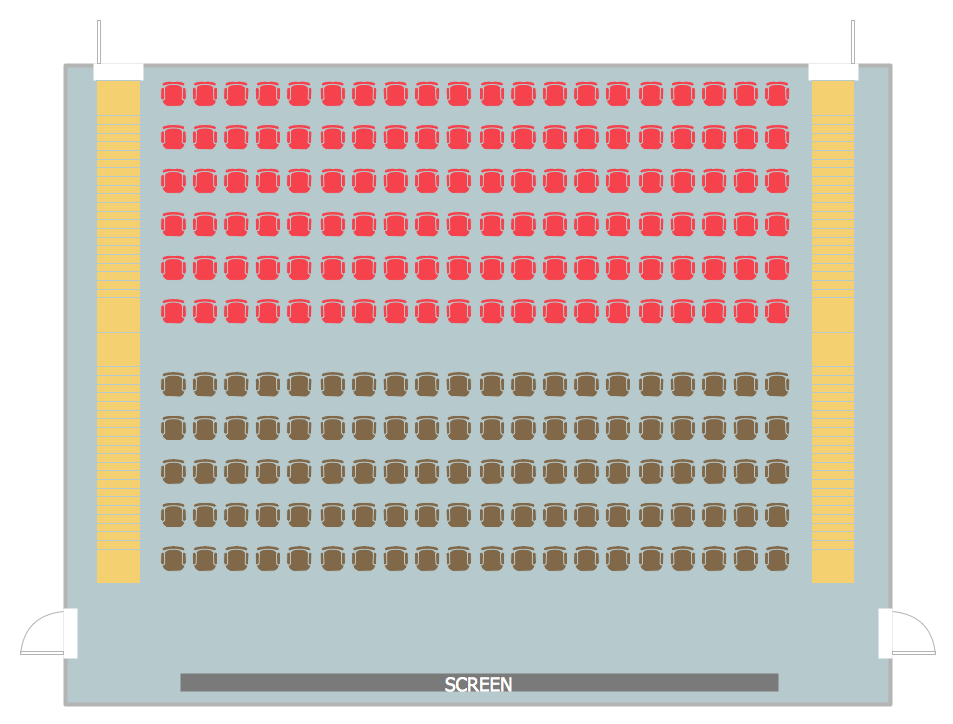
Seating Chart Template
Matrix Organization Structure

- How to Draw an Organization Chart | Organization Chart Templates ...
- Pie Chart Examples and Templates
- Matrix Organization Structure | Organizational Chart Template ...
- Line Chart Template for Word
- Pie Chart Software | Pie Chart Examples and Templates ...
- Donut Chart | Pie Chart Word Template . Pie Chart Examples | Pie ...
- Pie Chart Word Template
- Column Chart Template
- Free Flow Pyramid Charts Templates
- Bar Chart Template
- Line Chart Template for Word | Chart Maker for Presentations ...
- Line Chart Templates
- Arrow circle chart - Template | Pie Chart Examples and Templates ...
- Design elements - Area charts | Line Chart Template for Word | Pie ...
- Line Chart Template for Word | Basic Diagramming | Line Charts ...
- Matrix Organization Structure | Organizational Chart Templates ...
- Line Chart Template for Word | Organizational Chart Templates ...
- Organizational Chart Templates | Pie Chart Word Template . Pie ...
- Donut Chart Templates | Marketing | Six Markets Model Chart ...