This cycle diagram sample was created on the base of the figure illustrating the article "Environmental Materials" by Cris Arnold from the website of the UK Centre for Materials Education of the Higher Education Academy. "The figure ... schematically shows how the disparate areas under the heading of 'environmental materials' can be linked via a life cycle analysis approach. ...
Life Cycle Analysis.
Life Cycle Analysis is essentially a method of considering the entire environmental impact, energy and resource usage of a material or product. It is often known as a 'cradle-to-grave' analysis and can encompass the entire lifetime from extraction to end-of-life disposal. Life cycle analysis can be an extremely effective way of linking many different aspects of the environmental impacts of materials usage. ...
Materials Extraction and Resource Implications.
The environmental impact of raw materials extraction and processing together with global resource issues provides a good place to start consideration of environmental aspects of materials. ...
Environmental Impacts of Processing.
... Topics that would come under this subject area include the specific environmental problems associated with processing of metals, polymers, ceramics, composites etc, and how these problems can be overcome.
Design for Sustainability.
This area ... will ... cover issues such as design for successful recycling, waste minimisation, energy efficiency and increased lifetime.
Economic, Social and Legislative Issues.
... For example, materials selection within the automotive industry is now heavily influenced by 'end-of-life vehicle' and 'hazardous material' regulations.
Use of Sustainable Materials.
... It is probably sensible to define such materials as those that have distinct differences that achieve environmental benefit compared to conventional materials. With this definition, the list would include:
(1) Materials of a significantly plant-based nature, including wood, natural fibre composites, natural polymers.
(2) Materials produced using a large proportion of waste material, including recycled polymers, composites made from waste mineral powders, and arguably also much steel and aluminium.
Materials for Green Energy.
The most exciting developments in Materials Science are in the realm of functional materials, and many of these serve an environmentally-beneficial purpose, particularly in the production of green energy.
These include:
(1) Solar-cell materials.
(2) Fuel-cell technology.
(3) Catalytic pollution control.
End-of-Life Issues.
The treatment of materials at the end of their lifetime is a significant subject area and encompasses aspects such as recycling techniques and materials limitations, biodegradabilty and composting, chemical recovery and energy recovery." [materials.ac.uk/ guides/ environmental.asp]
The ring chart example "Life cycle analysis" was created using the ConceptDraw PRO diagramming and vector drawing software extended with the Target and Circular Diagrams solution from the Marketing area of ConceptDraw Solution Park.
www.conceptdraw.com/ solution-park/ marketing-target-and-circular-diagrams
Ring chart

Geo Map - USA - Illinois

 Pie Charts
Pie Charts are extensively used in statistics and business for explaining data and work results, in mass media for comparison (i.e. to visualize the percentage for the parts of one total), and in many other fields. The Pie Charts solution for ConceptDraw DIAGRAM offers powerful drawing tools, varied templates, samples, and a library of vector stencils for simple construction and design of Pie Charts, Donut Chart, and Pie Graph Worksheets.
Work Flow Process Chart

Scientific Symbols Chart

Mathematics Solution from the Science and Education area of ConceptDraw Solution Park includes a few shape libraries of plane, solid geometric figures, trigonometrical functions and greek letters to help you create different professional looking mathematic illustrations for science and education.
Basic Diagramming Flowchart Software

Critical Path Method in ConceptDraw PROJECT

Geo Map - Asia - Philippines

How to Create a Cross Functional Flow Chart

Marketing Charts

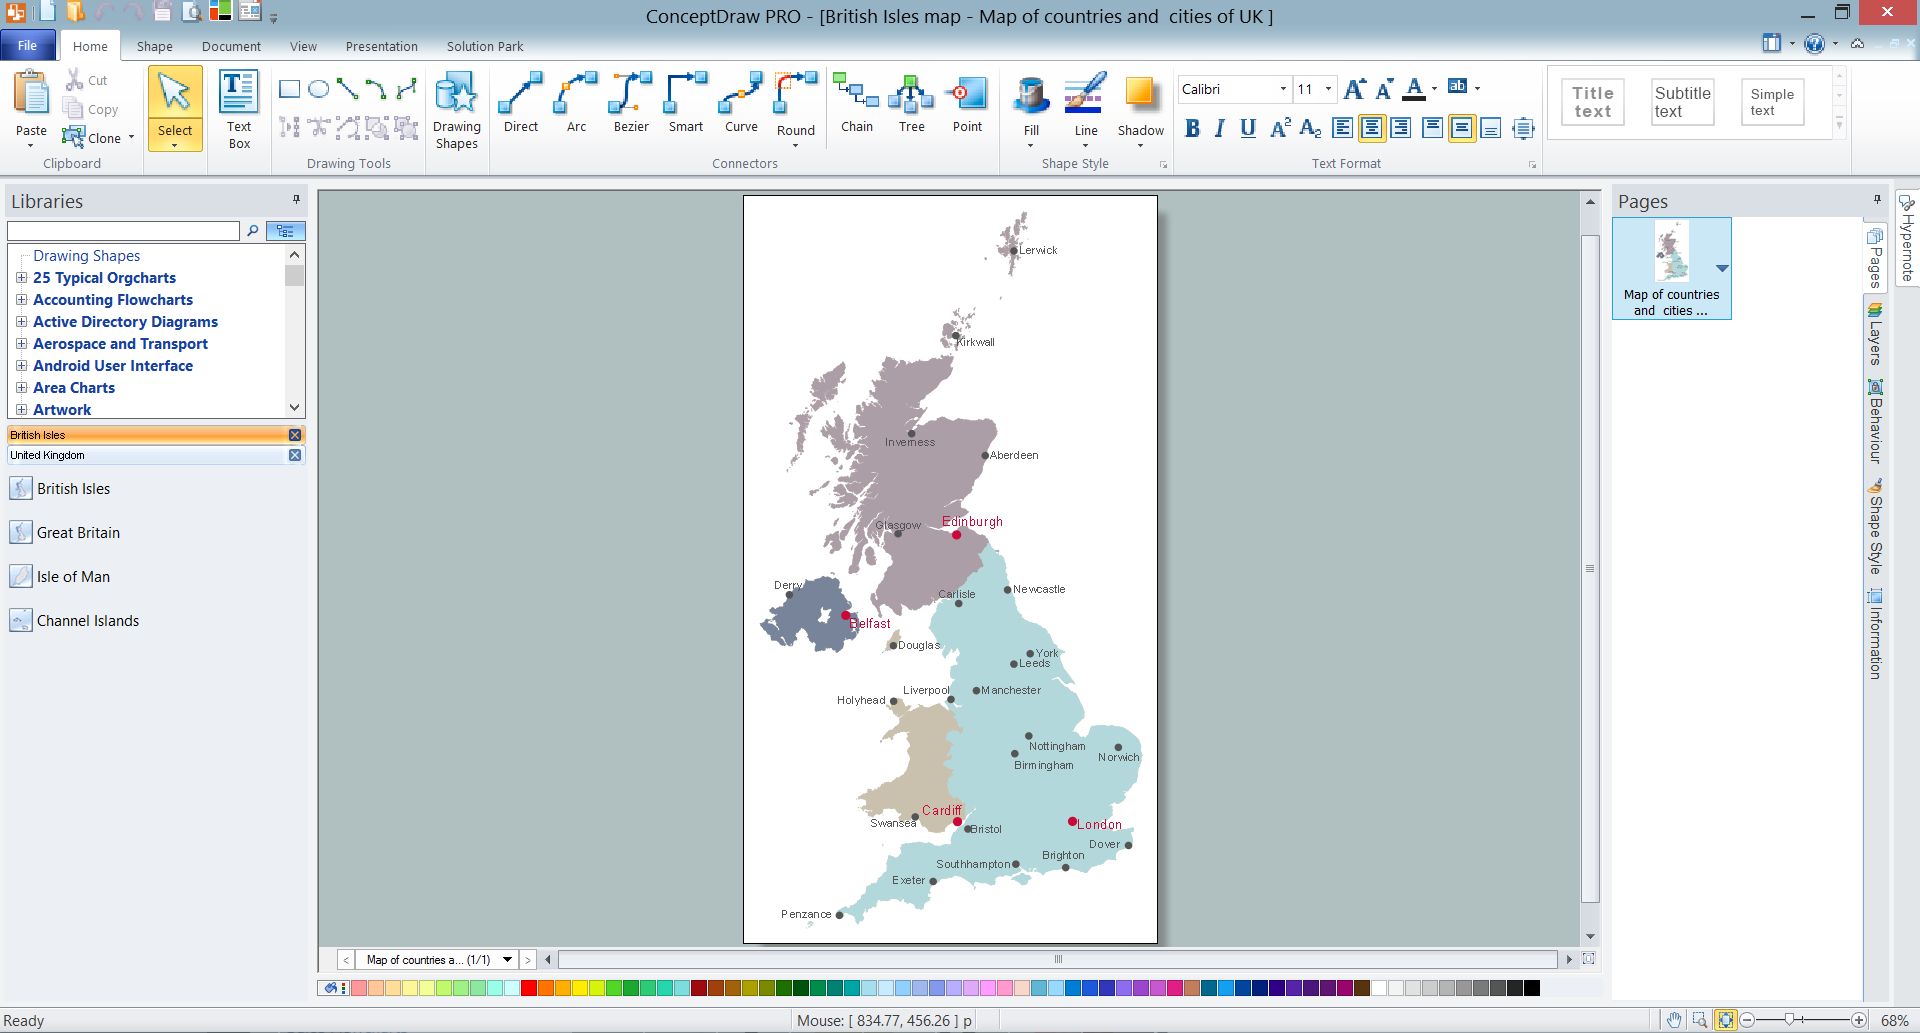
UK Map
Beautiful Nature Scene: Drawing

Process Flow Chart

ConceptDraw DIAGRAM Compatibility with MS Visio

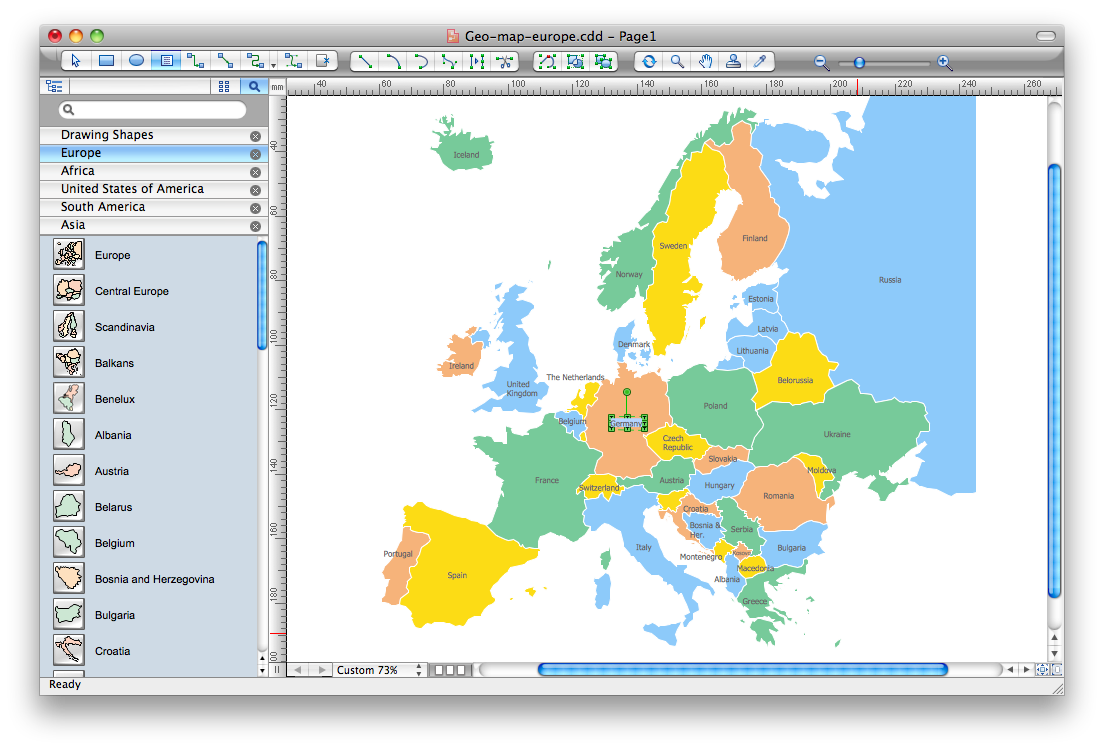
Map Software
- Graphs And Pie Chart On Conservation Of Natural Resources
- Conservation Of Natural Resources Pie Chart Maths
- Natural Resources Pie Chart
- How To Prepare A Pie Chart To Show The Natural Resources ...
- Management Of Natural Resource In Mathematics Pie Chart
- Natural Resources Pie Chart Graphs
- Pie Charts | Bar Diagram Math | UK Map | Natural Resources Pie ...
- Mangement Of Natural Resource Pie Chart Math
- Flow Chart On Classification Of Natural Resources With Eg
- Conservation Of Natural Resources With Charts
- Pie Chart Of Conservation Of Natural Resources
- Natural Resource Topic And Diagram
- Classification Of Natural Resources Chart
- Natural Resources In Math Pie Chart
- Flow Chart Of Natural Resources With Meaning And Examples
- Classification Of Natural Resources Flow Chart
- Graphs Pie Diagrams For Natural Resources
- Outline Diagram Of Natural Resources Pie Chart
- Natural Resources Types And Classification Chart
- Classification Of Natural Resources With Flow Chart Pdf