Example of Organizational Chart


Classroom Seating Chart Maker

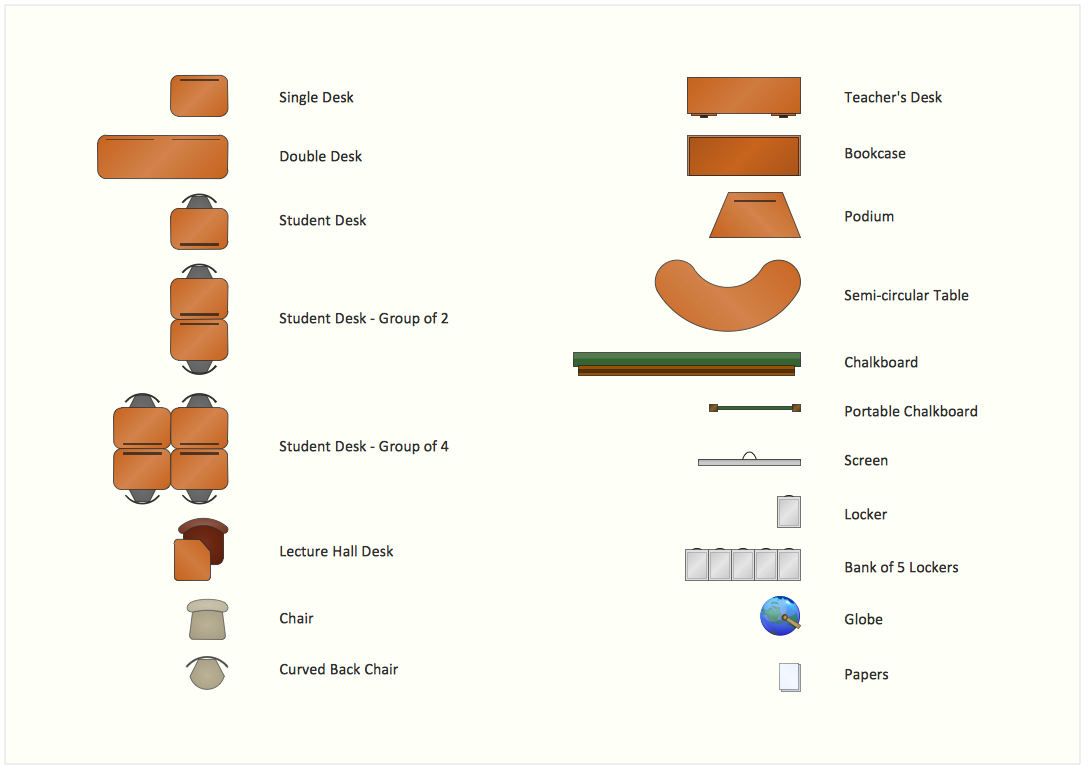
Interior Design. School Layout — Design Elements
 School and Training Plans
School and Training Plans solution enhances ConceptDraw DIAGRAM functionality with extensive drawing tools, numerous samples and examples, templates and libraries of classroom design elements for quick and professional drawing the School and Training plans, School Floor plans, Classroom Layout, Classroom Seating chart, Lecture Room plans of any complexity. Each offered classroom seating chart template is a real help for builders, designers, engineers, constructors, as well as teaching personnel and other teaching-related people in drawing Classroom Seating charts and Training Room layouts with ConceptDraw DIAGRAM classroom seating chart maker.
 Organizational Charts
Organizational Charts solution extends ConceptDraw DIAGRAM software with samples, templates and library of vector stencils for drawing the org charts.
 Seven Management and Planning Tools
Seven Management and Planning Tools solution extends ConceptDraw DIAGRAM and ConceptDraw MINDMAP with features, templates, samples and libraries of vector stencils for drawing management mind maps and diagrams.
 Line Graphs
How to draw a Line Graph with ease? The Line Graphs solution extends the capabilities of ConceptDraw DIAGRAM with professionally designed templates, samples, and a library of vector stencils for drawing perfect Line Graphs.
 Pie Charts
Pie Charts are extensively used in statistics and business for explaining data and work results, in mass media for comparison (i.e. to visualize the percentage for the parts of one total), and in many other fields. The Pie Charts solution for ConceptDraw DIAGRAM offers powerful drawing tools, varied templates, samples, and a library of vector stencils for simple construction and design of Pie Charts, Donut Chart, and Pie Graph Worksheets.
 Area Charts
Area Charts are used to display the cumulative totals over time using numbers or percentages; or to show trends over time among related attributes. The Area Chart is effective when comparing two or more quantities. Each series of data is typically represented with a different color, the use of color transparency in an object’s transparency shows overlapped areas and smaller areas hidden behind larger areas.
 Plumbing and Piping Plans
Plumbing and Piping Plans solution extends ConceptDraw DIAGRAM.2.2 software with samples, templates and libraries of pipes, plumbing, and valves design elements for developing of water and plumbing systems, and for drawing Plumbing plan, Piping plan, PVC Pipe plan, PVC Pipe furniture plan, Plumbing layout plan, Plumbing floor plan, Half pipe plans, Pipe bender plans.
 Cisco Network Diagrams
Cisco Network Diagrams solution extends ConceptDraw DIAGRAM with the best characteristics of network diagramming software. Included samples, templates and libraries of built-in standardized vector Cisco network icons and Cisco symbols of computers, network devices, network appliances and other Cisco network equipment will help network engineers, network designers, network and system administrators, as well as other IT professionals and corporate IT departments to diagram efficiently the network infrastructure, to visualize computer networks topologies, to design Cisco computer networks, and to create professional-looking Cisco Computer network diagrams, Cisco network designs and schematics, Network maps, and Network topology diagrams in minutes.
 Cross-Functional Flowcharts
Cross-functional flowcharts are powerful and useful tool for visualizing and analyzing complex business processes which requires involvement of multiple people, teams or even departments. They let clearly represent a sequence of the process steps, the order of operations, relationships between processes and responsible functional units (such as departments or positions).
 Histograms
How to make a Histogram? Making a Histogram is an incredibly easy process when it is done with ConceptDraw DIAGRAM. The Histograms Solution enhances ConceptDraw DIAGRAM functionality with extensive drawing tools, numerous samples, and examples; also a quick-start template and library of ready vector stencils for visualization the data and professional drawing Histograms.
 Bar Graphs
The Bar Graphs solution enhances ConceptDraw DIAGRAM functionality with templates, numerous professional-looking samples, and a library of vector stencils for drawing different types of Bar Graphs, such as Simple Bar Graph, Double Bar Graph, Divided Bar Graph, Horizontal Bar Graph, Vertical Bar Graph, and Column Bar Chart.
 Value Stream Mapping
Value stream mapping solution extends ConceptDraw DIAGRAM software with templates, samples and vector stencils for drawing the Value Stream Maps (VSM) in lean manufacturing practice.
- School and Training Plans | Flow Chart For Bank Institution
- School and Training Plans | Picture Graphs | Erd Design Of A Bank ...
- Office Design Of Bank On Chart
- Flowchart School Management System
- Example Of Organizational Chart In School
- What Is Diagram Chart Of First Bank
- Classroom Seating Chart Maker | School Crisis Plan
- Layout And Organization Chart Of Bank Vs Office
- School and Training Plans | Design elements - School layout plan ...
- Draw A System Model For A School System Using Structure Chart
- Bank Organizational Chart Sample
- Data Flow Diagrams (DFD) | Audit Flowcharts | Flowcharts | Bank ...
- Flowchart For Any Organizetion Either School Bank
- Example Of Bank Organizational Chart
- School and Training Plans | ATM UML Diagrams | Diagramming ...
- School and Training Plans | Data Flow Diagrams (DFD) | ATM UML ...
- Chart Diagram Example Bank
- School layout - Vector stencils library | Seating Chart Template ...
- School and Training Plans | Reflected Ceiling Plans | Seating Chart ...
- Hierarchy Chart For Bank Information System