 Circle-Spoke Diagrams
Examples of subject areas that are well suited to this approach are marketing, business, products promotion, process modeling, market, resource, time, and cost analysis. Circle-Spoke Diagrams are successfully used in presentations, conferences, management documents, magazines, reportages, reviews, reports, TV, and social media.
Org Chart Diagram

Circle Diagrams

HelpDesk
How to Create a Bubble Diagram

Metropolitan area networks (MAN). Computer and Network Examples
. Computer and Network Examples")

 PM Response
The PM Response solution extends the functional abilities in project management for all three ConceptDraw products by helping to improve the response time to project changes, to plan on how to effectively respond on issues and events impacting the project. It supplies the project managers, team leaders, and all other project participants with wide abilities of iteration planning, creative collaboration, effective decision-making, discussions of the project layout approaches and solving the project challenges, lets them use mind mapping technique for iteration planning and applying the project changes, to represent the projects data as Mind Maps and use them to construct the clear plans, to convert project maps to project implementations, to use different kinds of Visual diagrams to solve the current project problems and to make correct decisions, to plan resources usage and to respond to changes in the project environment.
HelpDesk
How to Format a Mind Map on PC

 Quality Mind Map
This solution extends ConceptDraw MINDMAP software with Quality Management Mind Maps (Presentations, Meeting Agendas, Problem to be solved).
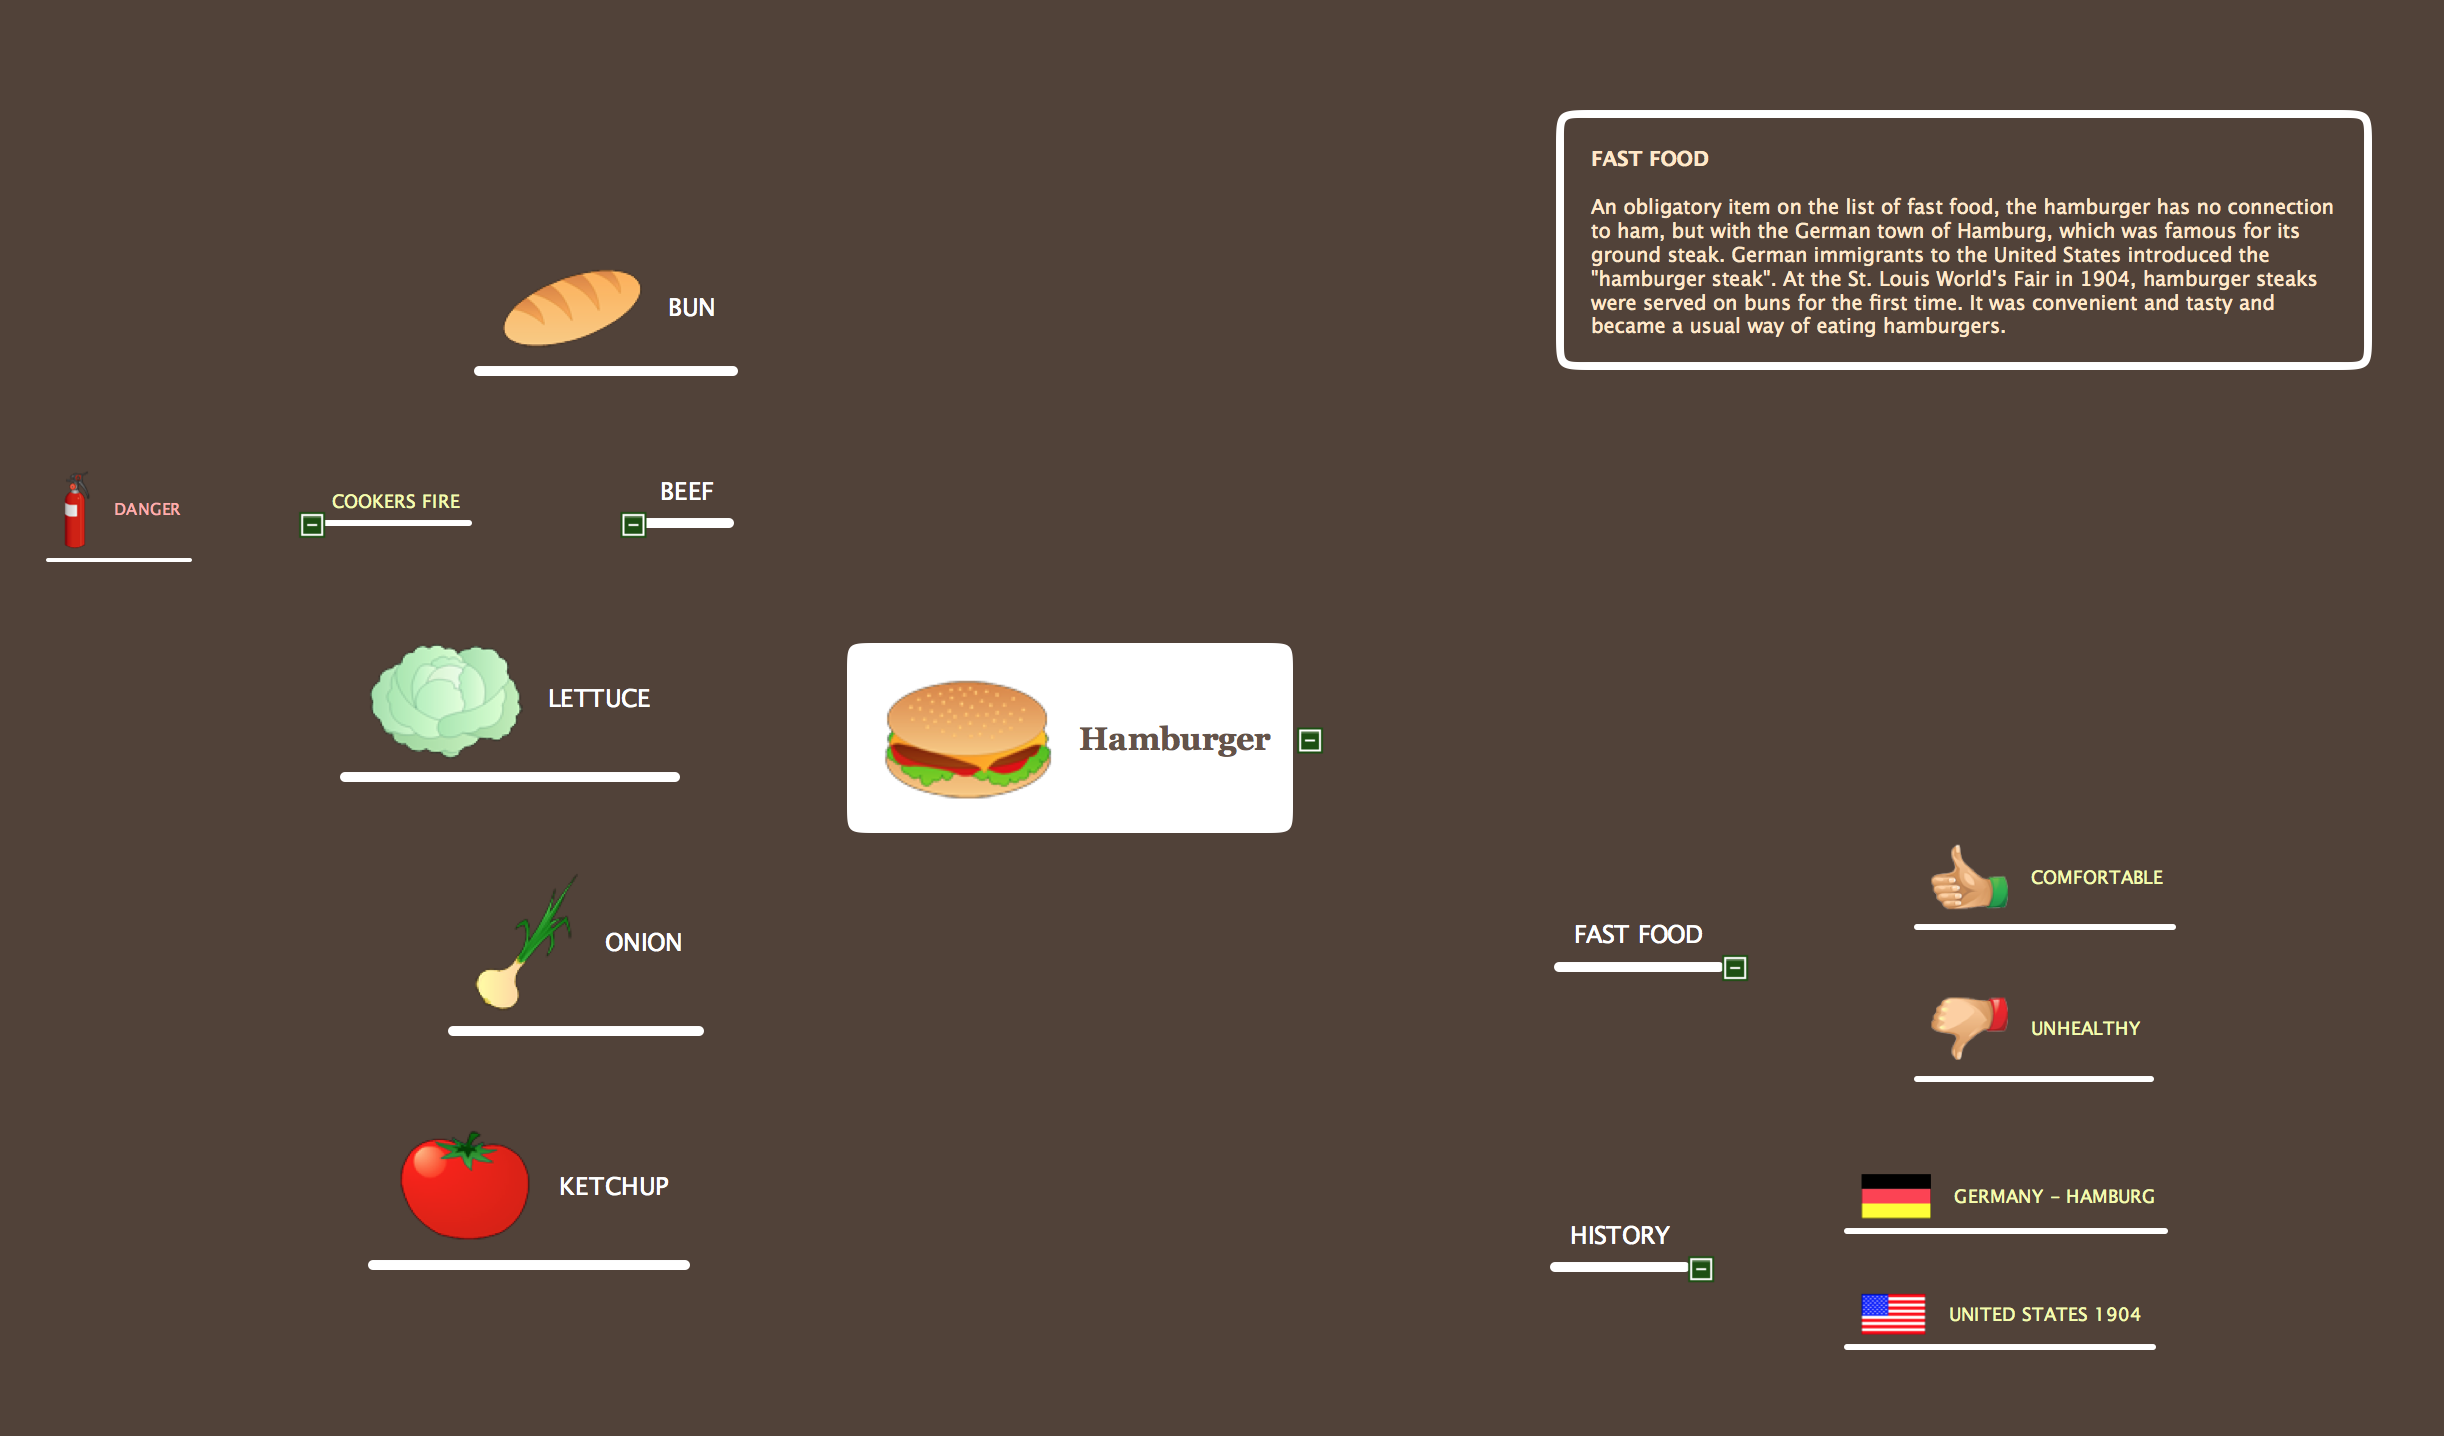
Mind Map Food
 SWOT Analysis
SWOT and TOWS Matrix Diagrams solution extends ConceptDraw DIAGRAM and ConceptDraw MINDMAP software with features, templates, samples and libraries of vector stencils for drawing SWOT and TOWS analysis matrices and mind maps.
- Orgchart | How to Draw an Organization Chart | Business Diagram ...
- Flowchart design. Flowchart symbols, shapes, stencils and icons ...
- Basic Diagramming | Community life cycle matrix - Ring chart | Pie ...
- Pyramid Chart Examples | Example of Organizational Chart | Ice ...
- SWOT Analysis | Competitor Analysis | Pyramid Chart Examples ...
- Matrix Organization Structure | Pyramid Diagram | Process Flowchart ...
- Venn Diagram Examples for Problem Solving. Environmental Social ...
- Pyramid Chart Examples | Life cycle analysis - Ring chart | Basic ...
- Employee Motivation Diagram
- Process Flowchart | Pyramid Chart Examples | Draw An ...
- Cable TV - Vector stencils library | Process Flowchart | Business ...
- Block diagram - Branding strategies | Pyramid Chart Examples ...
- Basic Circles Venn Diagram . Venn Diagram Example
- Leadership Training Influence | How to Create a Social Media DFD ...
- Export from ConceptDraw PRO Document to a Graphic File | How to ...
- BPM life cycle | Life cycle analysis - Ring chart | Community life cycle ...
- Spoke Diagram
- How to Create Organizational Chart Quickly | Org Chart Diagram ...
- Employee needs | HR Flowcharts | HR Flowchart Symbols ...
- Pyramid Chart Examples | Ice Hockey Diagram – Defensive Strategy ...