BPR Diagram. Business Process Reengineering Example

"An economic expansion is an increase in the level of economic activity, and of the goods and services available. It is a period of economic growth as measured by a rise in real GDP. The explanation of such fluctuations in aggregate economic activity is one of the primary concerns of macroeconomics.
Typically an economic expansion is marked by an upturn in production and utilization of resources. Economic recovery and prosperity are two successive phases of expansion. It may be caused by factors external to the economy, such as weather conditions or technical change, or by factors internal to the economy, such as fiscal policies, monetary policies, the availability of credit, interest rates, regulatory policies or other impacts on producer incentives. Global conditions may influence the levels of economic activity in various countries." [Economic expansion. Wikipedia]
"The term business cycle (or economic cycle or boom-bust cycle) refers to economy-wide fluctuations in production, trade and economic activity in general over several months or years in an economy organized on free-enterprise principles.
The business cycle is the upward and downward movements of levels of GDP (gross domestic product) and refers to the period of expansions and contractions in the level of economic activities (business fluctuations) around its long-term growth trend.
These fluctuations occur around a long-term growth trend, and typically involve shifts over time between periods of relatively rapid economic growth (an expansion or boom), and periods of relative stagnation or decline (a contraction or recession)." [Business cycle. Wikipedia]
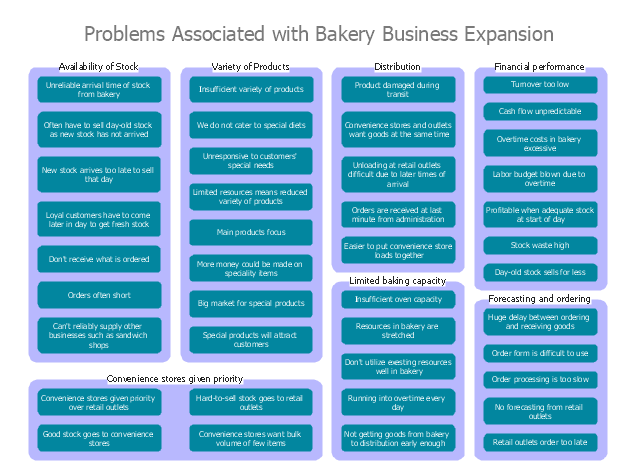
The affinity diagram example "Business expansion" was created using the ConceptDraw PRO diagramming and vector drawing software extended with the solution "Seven Management and Planning Tools" from the Management area of ConceptDraw Solution Park.
Typically an economic expansion is marked by an upturn in production and utilization of resources. Economic recovery and prosperity are two successive phases of expansion. It may be caused by factors external to the economy, such as weather conditions or technical change, or by factors internal to the economy, such as fiscal policies, monetary policies, the availability of credit, interest rates, regulatory policies or other impacts on producer incentives. Global conditions may influence the levels of economic activity in various countries." [Economic expansion. Wikipedia]
"The term business cycle (or economic cycle or boom-bust cycle) refers to economy-wide fluctuations in production, trade and economic activity in general over several months or years in an economy organized on free-enterprise principles.
The business cycle is the upward and downward movements of levels of GDP (gross domestic product) and refers to the period of expansions and contractions in the level of economic activities (business fluctuations) around its long-term growth trend.
These fluctuations occur around a long-term growth trend, and typically involve shifts over time between periods of relatively rapid economic growth (an expansion or boom), and periods of relative stagnation or decline (a contraction or recession)." [Business cycle. Wikipedia]
The affinity diagram example "Business expansion" was created using the ConceptDraw PRO diagramming and vector drawing software extended with the solution "Seven Management and Planning Tools" from the Management area of ConceptDraw Solution Park.
Affinity diagram
What is the Accounting Cycle?

Business Process Reengineering. Business Process Example

Workflow Diagram Examples

Basic Diagramming


Create Process Flowcharts

Circular Arrows

 Business and Finance
Use Business and Finance solution to make professional-looking documents, presentations and websites, business, finance, advertising, and project management illustrations, or any designs that requires clipart of currency, office, business, advertising, management, marketing, people, time, post, contacts, collaboration, etc.
This circular arrows diagram sample shows business process management life cycle.
It was designed on the base of the Wikimedia Commons file: Business Process Management Life-Cycle.svg. [commons.wikimedia.org/ wiki/ File:Business_ Process_ Management_ Life-Cycle.svg]
This file is licensed under the Creative Commons Attribution-Share Alike 3.0 Unported license. [creativecommons.org/ licenses/ by-sa/ 3.0/ deed.en]
"BPM life-cycle.
Business process management activities can be grouped into six categories: vision, design, modeling, execution, monitoring, and optimization.
Functions are designed around the strategic vision and goals of an organization. Each function is attached with a list of processes. Each functional head in an organization is responsible for certain sets of processes made up of tasks which are to be executed and reported as planned. Multiple processes are aggregated to function accomplishments and multiple functions are aggregated to achieve organizational goals." [Business process management. Wikipedia]
The arrow donut chart example "BPM life cycle" was created using the ConceptDraw PRO diagramming and vector drawing software extended with the Circular Arrows Diagrams solution from the area "What is a Diagram" of ConceptDraw Solution Park.
Circular arrows diagram

Draw Flowcharts with ConceptDraw

 Circular Arrows Diagrams
Circular Arrows Diagrams solution extends ConceptDraw PRO v10 with extensive drawing tools, predesigned samples, Circular flow diagram template for quick start, and a library of ready circular arrow vector stencils for drawing Circular Arrow Diagrams, Segmented Cycle Diagrams, and Circular Flow Diagrams. The elements in this solution help managers, analysts, business advisers, marketing experts, scientists, lecturers, and other knowledge workers in their daily work.
How To Create a FlowChart using ConceptDraw

Process Flowchart


Flow Chart Creator

- Business Cycle Diagram
- Example Of A Business Cycle
- BPR Diagram. Business Process Reengineering Example | Donut ...
- BPR Diagram. Business Process Reengineering Example | Program ...
- Business Cycle Circular Diagram
- Innovation life cycle - Arrow loop diagram | BPR Diagram. Business ...
- BPR Diagram. Business Process Reengineering Example | Strategic ...
- Business Process Reengineering Examples | BPR Diagram ...
- Business Cycle Flowchart
- Target and Circular Diagrams | Affinity diagram - Business ...
- Example Of Affinity Diagram Business Requirements
- Strategic planning - Cycle diagram | BPR Diagram. Business ...
- Give An Example Of Cycle Diagram
- Examples of Flowcharts, Org Charts and More | Business Processes ...
- Virtuous circle (macroeconomics) - Crystal diagram | Vicious circle ...
- Project management life cycle - Flowchart | Business Process ...
- Sample Of Clock Like Cycle Diagram
- How can you illustrate the weather condition | Affinity diagram ...
- Seven Management and Planning Tools | Affinity diagram ...
- Affinity Diagram Example