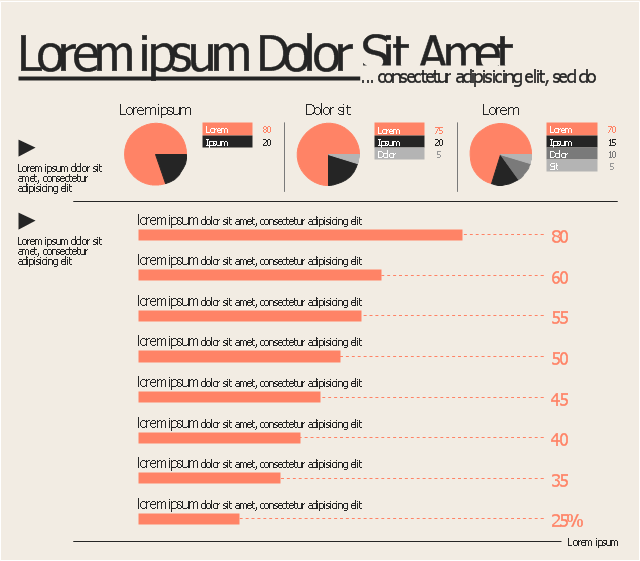
This marketing infographic template consists of design elements: title block, callout blocks, list bullets, pie chart, bullet indicators.
Use it to create your marketing infograms in the ConceptDraw PRO diagramming and vector drawing software.
The template "Marketing infogram 5" is included in the Marketing Infographics solution from the Business Infographics area of ConceptDraw Solution Park.
Use it to create your marketing infograms in the ConceptDraw PRO diagramming and vector drawing software.
The template "Marketing infogram 5" is included in the Marketing Infographics solution from the Business Infographics area of ConceptDraw Solution Park.
Marketing infogram template
Basic Flowchart Symbols and Meaning


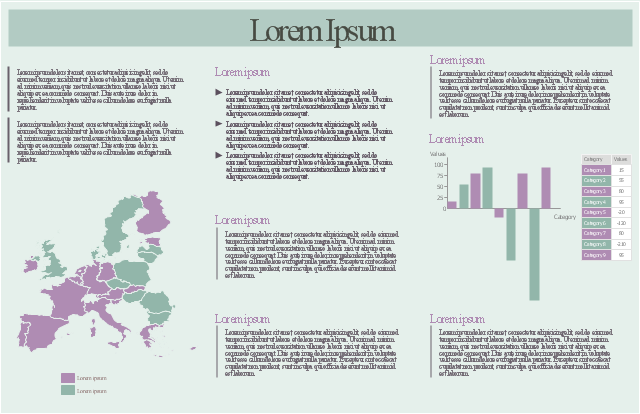
This marketing infographic template consists of design elements: title block, callout blocks, bulleted list blocks, thematic map and column chart (vertical bar graph).
Use it to create your marketing infograms in the ConceptDraw PRO diagramming and vector drawing software.
The template "Marketing infogram" is included in the Marketing Infographics solution from the Business Infographics area of ConceptDraw Solution Park.
Use it to create your marketing infograms in the ConceptDraw PRO diagramming and vector drawing software.
The template "Marketing infogram" is included in the Marketing Infographics solution from the Business Infographics area of ConceptDraw Solution Park.
Marketing infogram template
HelpDesk
How to Create a Typography Infographic Using ConceptDraw PRO

HelpDesk
How to Create a Meter Dashboard

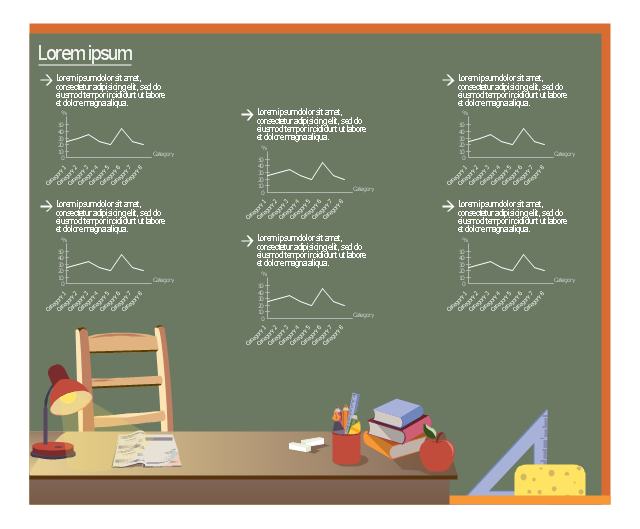
This education infographic template consists of design elements: callouts, bulleted list elements, line charts, pictograms, background.
Simply add text to design your own educational infogram.
The template "Education infogram 4" for the ConceptDraw PRO diagramming and vector drawing software is included in the Education Infographics solition from the area "Business Infographics" in ConceptDraw Solution Park.
Simply add text to design your own educational infogram.
The template "Education infogram 4" for the ConceptDraw PRO diagramming and vector drawing software is included in the Education Infographics solition from the area "Business Infographics" in ConceptDraw Solution Park.
Educational infogram template
The vector stencils library "Sales KPIs and Metrics" contains 15 chart templates and graphic indicators of sales key performance indicators (KPIs) and metrics for drawing sales dashboards: line charts "Cost per order" and "Clicks from Sales Follow-Up Emails", column charts "Social Media Usage" and "Usage Rate of Marketing Collateral", horizontal bar charts "Rate of Follow Up Contact", "Cost per customer" and "Lead Response Time", pie charts "Product mix", "Product Performance" and "Rate of Contact", gauge (speedometer) indicators "Sales Growth" and "Actual vs Plan", bullet indicator "Sales Target", diamond alarm indicators "Average Purchase Value", "Quote to Close Ratio", "Opportunity-to-Win Ratio" and "Sales Ratio".
The dashboard charts and indicators example "Design elements - Sales KPIs and metrics" for the ConceptDraw PRO diagramming and vector drawing software is included in the Sales Dashboard solution from the Marketing area of ConceptDraw Solution Park.
www.conceptdraw.com/ solution-park/ marketing-sales-dashboard
Sales dashboard charts and graphic indicators

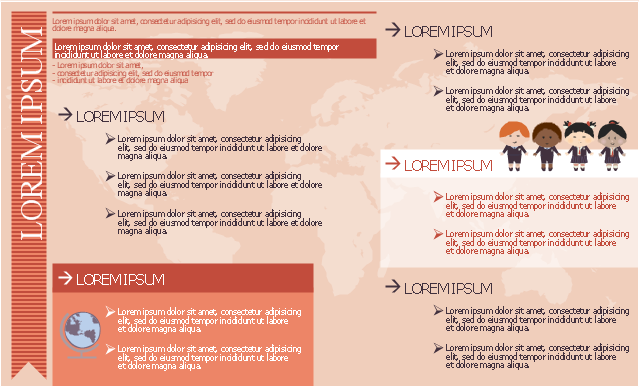
This education infographic template consists of design elements: title block, callouts, bulleted list elements, pictograms, world map background.
Simply add text to design your own educational infogram.
The template "Education infogram 3" for the ConceptDraw PRO diagramming and vector drawing software is included in the Education Infographics solition from the area "Business Infographics" in ConceptDraw Solution Park.
Simply add text to design your own educational infogram.
The template "Education infogram 3" for the ConceptDraw PRO diagramming and vector drawing software is included in the Education Infographics solition from the area "Business Infographics" in ConceptDraw Solution Park.
Educational infogram template
 Meter Dashboard
Meter dashboard solution extends ConceptDraw PRO software with templates, samples and vector stencils library with meter indicators for drawing visual dashboards showing quantitative data.
 Dashboards Area
Solutions from the area Dashboards of ConceptDraw Solution Park collects templates, samples and vector stencils libraries with of data driven charts and indicators for drawing the basic types of Visual Dashboards.
- List Bullet Png
- Infographic Templates For Bullets
- Triangular Bullet Typography
- Vertical White Line Transparent Png
- Speedometer Png
- Education infogram 4 - Template | Education infogram 5 - Template ...
- Arrow Bullet Vector Png
- Speedometer Vector Hd Png
- Ring Network Topology | Design elements - Meter indicators | IP ...
- Gauge Png
- Is Png Is Example Of Products Mix
- Vector Backgrounds Png
- Sector weightings - Exploded pie chart | Chart Templates | Pie Chart ...
- Horizontal White Line Png
- Column Vector Png
- Horizontal Vector Png
- Design elements - Bulleted and numbered lists | Design elements ...
- Infographics Bullets
- Process Flowchart | Process Flow Diagram Symbols | Process ...
- 3-Level 3D pyramid diagram - Template