Entity Relationship Software

Martin ERD Diagram

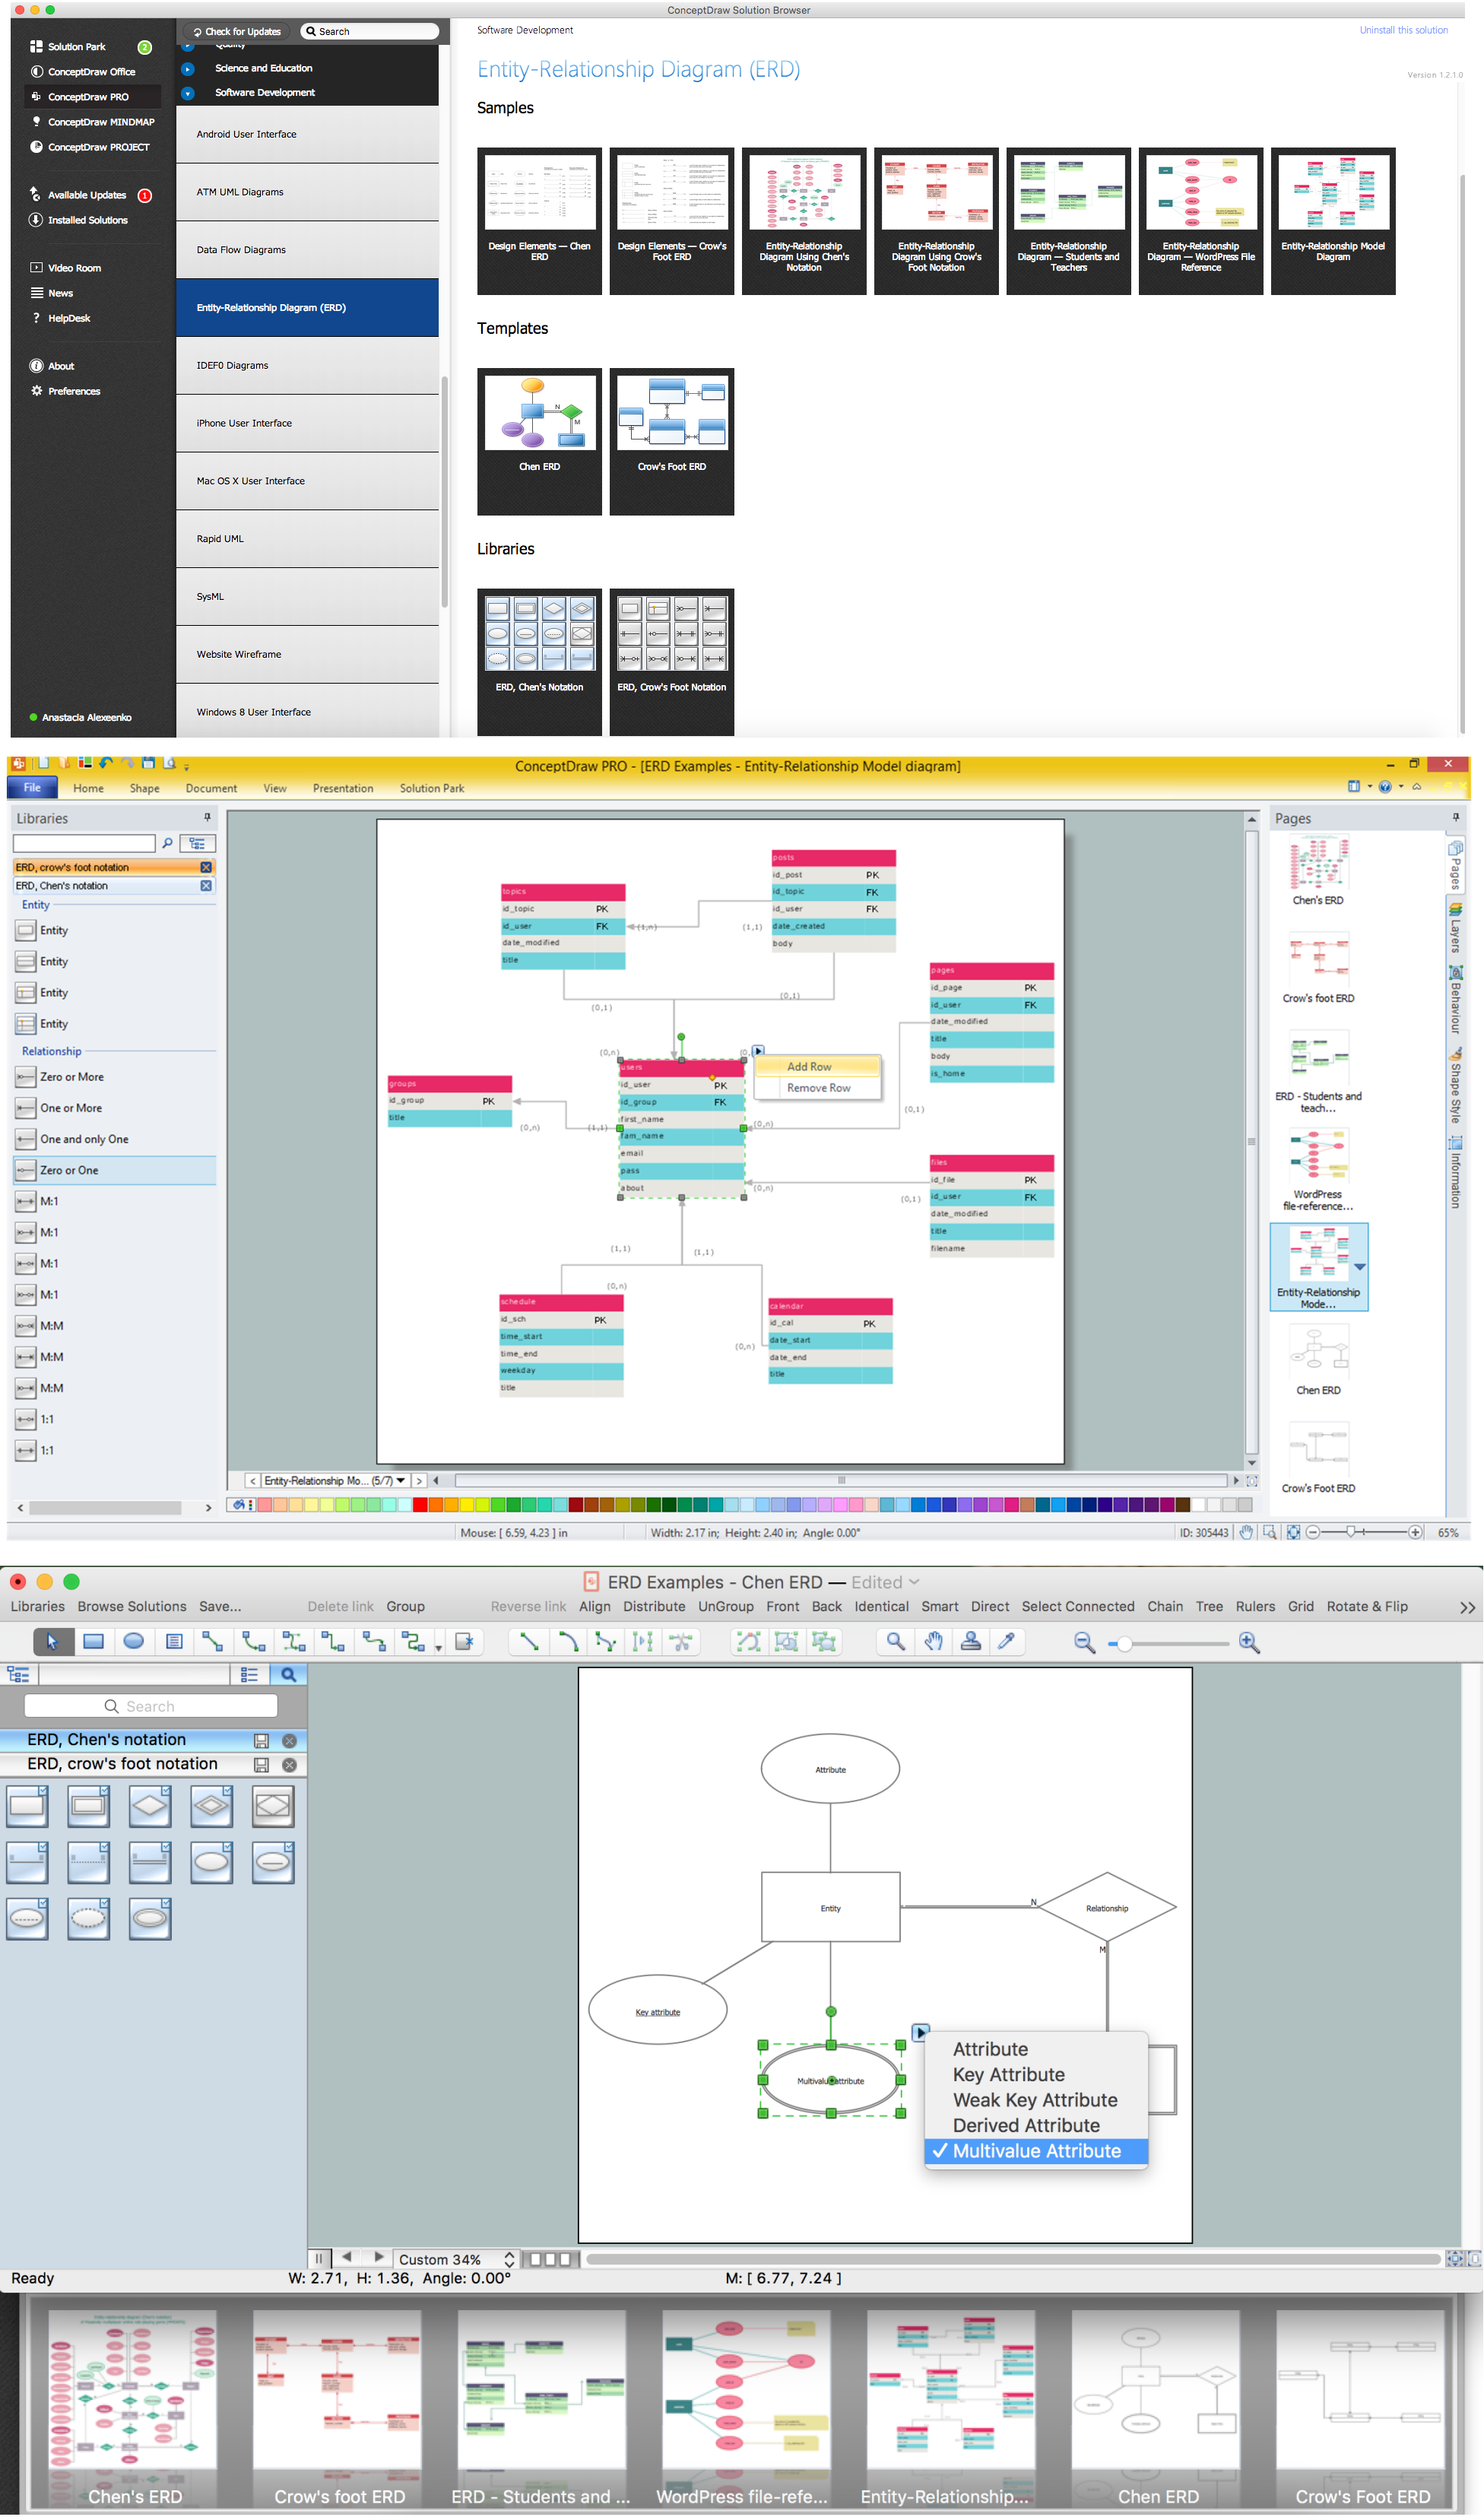
 Entity-Relationship Diagram (ERD)
An Entity-Relationship Diagram (ERD) is a visual presentation of entities and relationships. That type of diagrams is often used in the semi-structured or unstructured data in databases and information systems. At first glance ERD is similar to a flowch
"Crow's Foot notation is used in Barker's Notation, SSADM and Information Engineering. Crow's Foot diagrams represent entities as boxes, and relationships as lines between the boxes. Different shapes at the ends of these lines represent the cardinality of the relationship." [Entity–relationship model. Wikipedia]
The vector stencils library ERD, crow's foot notation contains 18 symbols for creating the ER-diagrams using the ConceptDraw PRO diagramming nd vector drawing software.
The example"Design elements - ERD solution (crow's foot notation)" is included in the Entity-Relationship Diagram (ERD) solution from the Software Development area of ConceptDraw Solution Park.
Crow's foot ERD
.png--diagram-flowchart-example.png)
Entity Relationship Diagram Software
"In software engineering, an entity–relationship model (ER model) is a data model for describing a database in an abstract way. ...
Crow's Foot notation is used in Barker's Notation, SSADM and Information Engineering. Crow's Foot diagrams represent entities as boxes, and relationships as lines between the boxes. Different shapes at the ends of these lines represent the cardinality of the relationship." [Entity–relationship model. Wikipedia]
This ERD example was redesigned using the ConceptDraw PRO diagramming and vector drawing software from the educational data base model. [www2.cs.uregina.ca/ ~bernatja/ crowsfoot.html]
The example "Entity-relationship diagram (Crow's foot notation)" is included in the Entity-Relationship Diagram (ERD) solution from the Software Development area of ConceptDraw Solution Park.
Crow's foot ERD
.png--diagram-flowchart-example.png)
Software and Database Design with ConceptDraw DIAGRAM

Data structure diagram with ConceptDraw DIAGRAM

IDEF0 standard with ConceptDraw DIAGRAM

- ERD Symbols and Meanings | Design elements - ER diagram (Chen ...
- UML Notation | Notation &Symbols for ERD | Business Process ...
- Design elements - ER diagram (Chen notation) | Crow's foot ERD ...
- Entity-relationship diagram (Crow's foot notation) | Design elements ...
- Design elements - IDEF0 diagram | ERD Symbols and Meanings ...
- Entity Relationship Diagram Examples | Design elements - ERD ...
- Entity-relationship diagram (Crow's foot notation)
- Fishbone Diagram | Note Exchange | Entity-relationship diagram ...
- Entity-relationship diagram (Crow's foot notation)
- Entity-Relationship Diagram ( ERD ) | ERD Symbols and Meanings ...
- Entity-relationship diagram (Crow's foot notation) | ConceptDraw ...
- Entity-Relationship Diagram
- Design Element: Crows Foot for Entity Relationship Diagram - ERD ...
- ERD Symbols and Meanings | Entity-Relationship Diagram ( ERD ...
- Entity Relationship Diagram Software Engineering | Entity ...
- ERD Symbols and Meanings | Entity Relationship Diagram Symbols ...
- Entity-relationship diagram (Crow's foot notation) | ERD Symbols ...
- Mobile satellite TV network diagram | Network Diagram Software ...
- Entity Relationship Diagram Examples
- Entity Relationship Diagram Software Engineering | Chen ERD ...