UML Collaboration Diagram (UML2.0)


"An example scenario is presented to demonstrate how a common issue tracking system would work:
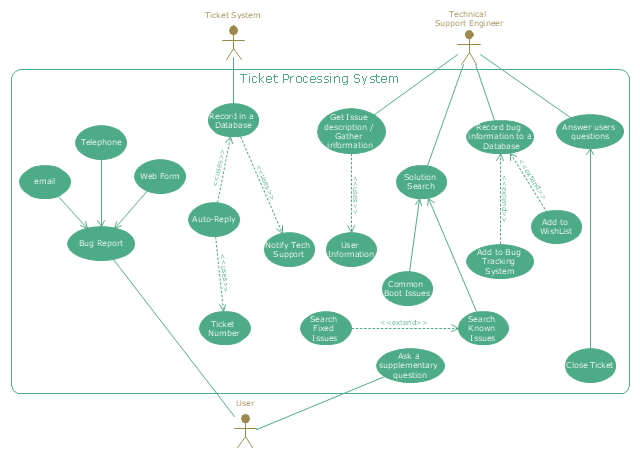
(1) A customer service technician receives a telephone call, email, or other communication from a customer about a problem. Some applications provide built-in messaging system and automatic error reporting from exception handling blocks.
(2) The technician verifies that the problem is real, and not just perceived. The technician will also ensure that enough information about the problem is obtained from the customer. This information generally includes the environment of the customer, when and how the issue occurs, and all other relevant circumstances.
(3) The technician creates the issue in the system, entering all relevant data, as provided by the customer.
(4) As work is done on that issue, the system is updated with new data by the technician. Any attempt at fixing the problem should be noted in the issue system. Ticket status most likely will be changed from open to pending.
(5) After the issue has been fully addressed, it is marked as resolved in the issue tracking system.
If the problem is not fully resolved, the ticket will be reopened once the technician receives new information from the customer. A Run Book Automation process that implements best practices for these workflows and increases IT personnel effectiveness is becoming very common." [Issue tracking system. Wikipedia]
The UML use case diagram example "Ticket processing system" was created using the ConceptDraw PRO diagramming and vector drawing software extended with the Rapid UML solution from the Software Development area of ConceptDraw Solution Park.
UML use case diagram
 Business Process Diagrams
Business Process Diagrams solution extends the ConceptDraw PRO BPM software with RapidDraw interface, templates, samples and numerous libraries based on the BPMN 1.2 and BPMN 2.0 standards, which give you the possibility to visualize equally easy simple and complex processes, to design business models, to quickly develop and document in details any business processes on the stages of project’s planning and implementation.
 Event-driven Process Chain Diagrams
Event-driven Process Chain (EPC) Diagram is a type of flowchart widely used for modeling in business engineering and reengineering, business process improvement, and analysis. EPC method was developed within the Architecture of Integrated Information Systems (ARIS) framework.
Jacobson Use Cases Diagram

Cross-Functional Flowchart


Basic Flowchart Symbols and Meaning


This hotel computer reservations system cycle process chart example was redesigned from the Wikimedia Commons file: По-запросу.jpg.
[commons.wikimedia.org/ wiki/ File:По-запросу.jpg]
"A computer reservations system or central reservation system (CRS) is a computerized system used to store and retrieve information and conduct transactions related to air travel, hotels, car rental, or activities. ...
Modern GDSes typically allow users to book hotel rooms, rental cars, airline tickets as well as activities and tours." [en.wikipedia.org/ wiki/ Computer_ reservations_ system]
The cycle process diagram example "Hotel reservation system" was created using the ConceptDraw PRO diagramming and vector drawing software extended with the Sales Flowcharts solution from the Marketing area of ConceptDraw Solution Park.
Hotel computer reservation system - Cycle process diagram

Types of Flowchart - Overview


- Booking process - BPMN 2.0 diagram | Business Process Modeling ...
- UML Collaboration Diagram (UML2.0) | UML Diagrams with ...
- UML sequence diagram - Ticket processing system | UML sequence ...
- Design Algorithm And Flowchart For Ticket Book Process Ticket
- UML Collaboration Diagram (UML2.0) | Last resort hotel book room ...
- Business Process Model Example For Booking A Trip
- Ticket System Flowchart Examples
- Marketing Diagram Ticket Sales
- UML Collaboration Diagram (UML2.0) | Last resort hotel book room ...
- Sequence Diagram For Book Issue Process Of Library
- Entity Relationship Diagram ( ERD ) Solution. ConceptDraw.com ...
- Deployment Diagram For Online Bookstore In Uml
- Data Flow Diagrams (DFD) | Cross Functional Flowchart Example ...
- Statechart Diagram For Online Book Store
- UML Collaboration Diagram (UML2.0) | Online Book Shopping Ppt ...
- Draw Sequence Diagram For Book Issue Process Of Library
- Er Diagram For Online Book Shop Database System
- UML sequence diagram - Ticket processing system | Error Scenario ...
- Business Process Diagrams | Dfd Diagrams Of Issuing Book From Lib
- Er Diagram For Book Store