Types of Flowcharts


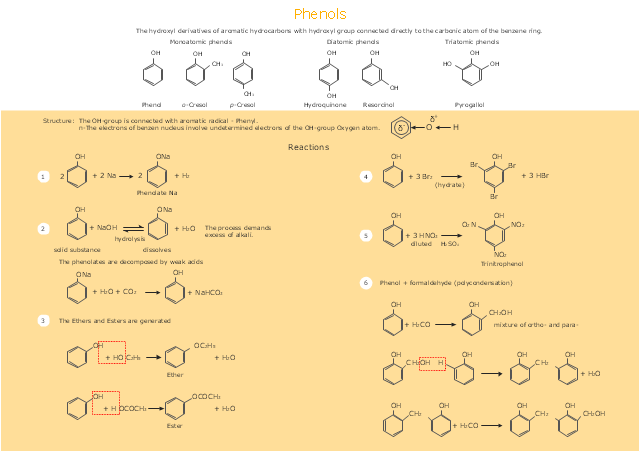
This drawing illustrates examples o f phenolic compounds molecular structures, and chemical reactions of phenols.
"In organic chemistry, phenols, sometimes called phenolics, are a class of chemical compounds consisting of a hydroxyl group (-OH) bonded directly to an aromatic hydrocarbon group. The simplest of the class is phenol, which is also called carbolic acid C6H5OH. Phenolic compounds are classified as simple phenols or polyphenols based on the number of phenol units in the molecule. ...
Although similar to alcohols, phenols have unique properties and are not classified as alcohols (since the hydroxyl group is not bonded to a saturated carbon atom). They have higher acidities due to the aromatic ring's tight coupling with the oxygen and a relatively loose bond between the oxygen and hydrogen. The acidity of the hydroxyl group in phenols is commonly intermediate between that of aliphatic alcohols and carboxylic acids (their pKa is usually between 10 and 12).
Loss of a positive hydrogen ion (H+) from the hydroxyl group of a phenol forms a corresponding negative phenolate ion or phenoxide ion, and the corresponding salts are called phenolates or phenoxides, although the term aryloxides is preferred according to the IUPAC Gold Book. Phenols can have two or more hydroxy groups bonded to the aromatic ring(s) in the same molecule. The simplest examples are the three benzenediols, each having two hydroxy groups on a benzene ring." [Phenols. Wikipedia]
The chemical drawing example "Phenols" was created using the ConceptDraw PRO software extended with the Chemistry solution from the Science and Education area of ConceptDraw Solution Park.
Phenolic compounds and phenol reactions
 Venn Diagrams
Venn Diagrams are actively used to illustrate simple set relationships in set theory and probability theory, logic and statistics, mathematics and computer science, linguistics, sociology, and marketing. Venn Diagrams are also often used to visually summarize the status and future viability of a project.
 Ice Hockey
The Ice Hockey Solution extends the capabilities of ConceptDraw PRO v9.5 (or later) with samples, templates, and libraries of vector objects for drawing hockey diagrams, plays schemas, and illustrations. The Ice Hockey Solution can be used to make polishe
 25 Typical Orgcharts
The 25 Typical Orgcharts solution contains powerful organizational structure and organizational management drawing tools, a variety of professionally designed organization chart and matrix organization structure samples, 25 templates based on various orga
 Nature
This solution extends ConceptDraw PRO software with samples, templates and libraries of vector clipart for drawing the Nature illustrations. Use it to make professional-looking documents, presentations and websites illustrated with color scalable vector c
 Accounting Flowcharts
Accounting Flowcharts solution extends ConceptDraw PRO software with templates, samples and library of vector stencils for drawing the accounting flow charts.
 Pie Charts
Pie Charts are extensively used in statistics and business for explaining data and work results, in mass media for comparison (i.e. to visualize the percentage for the parts of one total), and in many other fields. The Pie Charts solution for ConceptDraw PRO v10 offers powerful drawing tools, varied templates, samples, and a library of vector stencils for simple construction and design of Pie Charts, Donut Chart, and Pie Graph Worksheets.
- How to Draw a Chemical Process Flow Diagram | Chemical and ...
- Chemistry Drawing Software | Chemistry Drawings | Chemistry ...
- Design elements - Conformations | Chemistry Drawings ...
- Chemistry | Design elements - Chemical drawings | Chemistry ...
- Design elements - Chemical drawings | Chemistry Drawings ...
- How to Draw Chemistry Structures | Chemistry Drawings | Chemistry ...
- Chemistry Drawings | Chemistry | Chemistry Drawing Software ...
- Piping and Instrumentation Diagram Software | Chemical and ...
- Blank Scatter Plot | Four Dimensions Bubble Plot | Best ...
- Chemical engineering - Vector stencils library | Mechanical Drawing ...
- Mechanical Drawing Symbols | Mechanical Engineering | Design ...
- Biology | Biology Drawing Software | Biology Drawing | Diagram To ...
- Design elements - Chemical drawings | Phenols | Carbonyl ...
- How To Draw an iPhone? | Design elements - iPhone 6 mockup ...
- Process Flowchart | Process and Instrumentation Diagram | Process ...
- Chemical Accidents Symbols To Draw
- Biology Drawing | Biology | Conformations - Vector stencils library ...
- Basic Flowchart Symbols and Meaning | Entity Relationship ...
- Drawing Symbol And Meaning
- Design elements - Biochemistry of metabolism | Metabolic pathway ...