 Basic Pie Charts
This solution extends the capabilities of ConceptDraw PRO v10.3.0 (or later) with templates, samples, and a library of vector stencils for drawing pie and donut charts.
 Pie Charts
Pie Charts are extensively used in statistics and business for explaining data and work results, in mass media for comparison (i.e. to visualize the percentage for the parts of one total), and in many other fields. The Pie Charts solution for ConceptDraw PRO v10 offers powerful drawing tools, varied templates, samples, and a library of vector stencils for simple construction and design of Pie Charts, Donut Chart, and Pie Graph Worksheets.
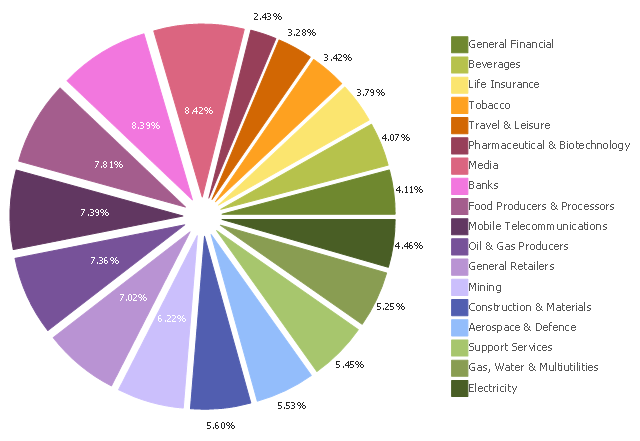
This exploded pie chart example shows the economics sector weightings. It was designed on the base of the Wikimedia Commons file: Badpie.png [commons.wikimedia.org/ wiki/ File:Badpie.png].
This image is available under the Creative Commons Attribution-ShareAlike 3.0 Unported License [creativecommons.org/ licenses/ by-sa/ 3.0/ ].
"The classical breakdown of all economic sectors follows:
Primary: Involves the retrieval and production of raw materials, such as corn, coal, wood and iron. (A coal miner and a fisherman would be workers in the primary sector.)
Secondary: Involves the transformation of raw or intermediate materials into goods e.g. manufacturing steel into cars, or textiles into clothing. (A builder and a dressmaker would be workers in the secondary sector.)
Tertiary: Involves the supplying of services to consumers and businesses, such as baby-sitting, cinema and banking. (A shopkeeper and an accountant would be workers in the tertiary sector.)
In the 20th century, it began to be argued that traditional tertiary services could be further distinguished from "quaternary" and quinary service sectors." [Economic sector. Wikipedia]
The exploded pie chart example "Economics sector weightings" was created using the ConceptDraw PRO diagramming and vector drawing software extended with the Basic Pie Charts solution of the Graphs and Charts area in ConceptDraw Solution Park.
Exploded pie chart
 Health Food
The Health Food solution contains the set of professionally designed samples and large collection of vector graphic libraries of healthy foods symbols of fruits, vegetables, herbs, nuts, beans, seafood, meat, dairy foods, drinks, which give powerful possi
 iPhone User Interface
iPhone User Interface solution extends ConceptDraw PRO v10 software with templates, samples and libraries with large quantity of vector stencils of graphical user interface elements, Apps icons, UI patterns for designing and prototyping of the iOS applic
 Sales Flowcharts
The Sales Flowcharts solution lets you create and display sales process maps, sales process workflows, sales steps, the sales process, and anything else involving sales process management.
 Basic Floor Plans
Detailed floor plan is the basis of any building project, whether a home, office, business center, restaurant, shop store, or any other building or premise. Basic Floor Plans solution is a perfect tool to visualize your creative projects, architectural and floor plans ideas.
 Basic Venn Diagrams
This solution extends ConceptDraw PRO v10 (or later) with samples, templates, and libraries of vector stencils for drawing Venn Diagrams.
 Network Security Diagrams
The Network Security Diagrams solution presents a large collection of predesigned cybersecurity vector stencils, cliparts, shapes, icons and connectors to help you succeed in designing professional and accurate Network Security Diagrams, Network Security Infographics to share knowledge about effective ways of networks protection with help of software and network security devices of different cyber security degrees, Network Plans for secure wireless network, Computer Security Diagrams to visually tell about amazing possibilities of IT security solutions. The samples and examples reflect the power of ConceptDraw PRO software in drawing Network Security Diagrams, give the representation about variety of existing types of attacks and threats, help to realize their seriousness and the methods to deal with them.
 Basic Line Graphs
This solution extends the capabilities of ConceptDraw PRO v10.3.0 (or later) with templates, samples and a library of vector stencils for drawing Line Graphs.
 Basic EPC Diagrams
The Event-driven Process Chain Diagrams solution extends ConceptDraw PRO software with EPC templates, samples, and vector shape library for the drawing of EPC diagrams.
- Circular Arrows Diagrams | Basic Flowchart Symbols and Meaning ...
- Pie Charts | Donut Chart | Chart Templates | Donut Chart Png
- Pie Charts | Pie Chart Examples and Templates | Best Diagramming ...
- Bar Chart | Basic Diagramming | Column Chart Template | Beautiful ...
- Pie Charts | Circular diagrams - Vector stencils library | Pie Chart ...
- Pie Charts | Wireless Network Mode | IDEF3 Standard | Smart Phone ...
- Basic Diagramming | Beautiful Nature Scene: Drawing | Chart ...
- Pie Charts | Percentages of the U.S. population by race | Bar Graphs ...
- Pie Charts | DroidDia prime | Pie Chart Software | Circle Graph Png ...
- Pie Charts | Types of Flowcharts | Map symbols - Vector stencils ...
- 2 3 Pie Chart Png
- Chart Pie Png
- Pie Chart Circle Png
- Pie Charts | ConceptDraw Solution Park | Cisco Network Diagrams ...
- Process Flowchart | Basic Diagramming | Rainfall Bar Chart | Green ...
- Circle Donut Png
- Economics Png
- Loyalty - Arrow circle diagram | Basic Flowchart Symbols and ...
- Pie charts - Vector stencils library | Pie Charts | Percentage Pie ...
- Pie Circle Png