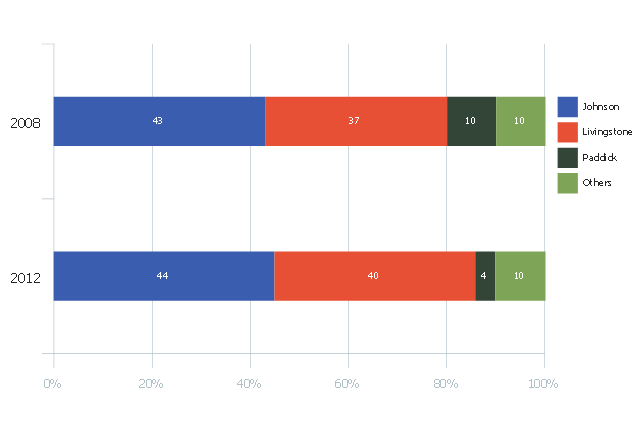
This divided bar diagram sample shows London election results in 2008 and 2012. It was drawn using data from the infographics "London Elections Results by Numbers" on the london.gov.uk website.
[data.london.gov.uk/ datastore/ package/ london-elections-results-2012-wards-boroughs-constituency]
"There are six types of elections in the United Kingdom: United Kingdom general elections, elections to devolved parliaments and assemblies, elections to the European Parliament, local elections, mayoral elections and Police and Crime Commissioner elections. Elections are held on Election Day, which is conventionally a Thursday. General elections do not have fixed dates, but must be called within five years of the opening of parliament following the last election. Other elections are held on fixed dates, though in the case of the devolved assemblies and parliaments early elections can occur in certain situations. Currently, six electoral systems are used: the single member plurality system (First Past the Post), the multi member plurality system, party list PR, the single transferable vote, the Additional Member System and the Supplementary Vote.
Elections are administered locally: in each lower-tier local authority, the actual polling procedure is run by the Returning Officer and the compiling and maintenance of the electoral roll by the Electoral Registration Officer (except in Northern Ireland, where the Electoral Office for Northern Ireland assumes both responsibilities). The Electoral Commission only sets standards for and issues guidelines to Returning Officers and Electoral Registration Officers, but is responsible for nationwide electoral administration (such as the registration of political parties and directing the administration of national referendums)." [Elections in the United Kingdom. Wikipedia]
The chart example "London election results" was created using the ConceptDraw PRO diagramming and vector drawing software extended with the Divided Bar Diagrams solution from the Graphs and Charts area of ConceptDraw Solution Park.
Divided bar chart
Bar Diagram Math

 Basic Divided Bar Diagrams
This solution extends the capabilities of ConceptDraw DIAGRAM (or later) with templates, samples and a library of vector stencils for drawing Divided Bar diagrams.
Chart Templates

Chart Examples

Pie Graph
Relative Value Chart Software

 Pie Charts
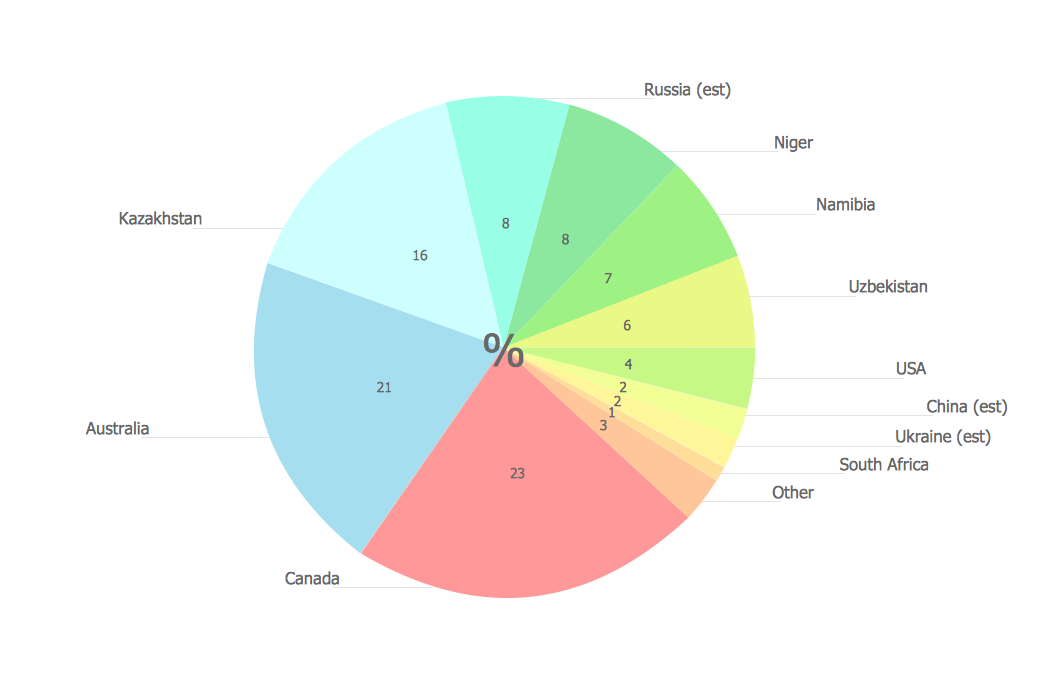
Pie Charts are extensively used in statistics and business for explaining data and work results, in mass media for comparison (i.e. to visualize the percentage for the parts of one total), and in many other fields. The Pie Charts solution for ConceptDraw DIAGRAM offers powerful drawing tools, varied templates, samples, and a library of vector stencils for simple construction and design of Pie Charts, Donut Chart, and Pie Graph Worksheets.
Pie Chart Examples and Templates

 Frequency Distribution Dashboard
Frequency distribution dashboard solution extends ConceptDraw DIAGRAM software with samples, templates and vector stencils libraries with histograms and area charts for drawing the visual dashboards showing frequency distribution of data.
- Continent Maps | Bar Graph 2016 Election
- London election results | Relative Value Chart Software | Bar ...
- Uses Of All Types Of Bar Graph In Election Result
- Prepare A Bar Chart And Pie Chart For Analysis Of Election Results
- How to Draw a Divided Bar Chart in ConceptDraw PRO | Divided ...
- Steps To Draw A Bar Chart And Pie Chart Of Election Result
- Bar Graphs | Bar Diagrams for Problem Solving. Create economics ...
- Prepare A Pie Chart For Analysis Of Election Result Com
- London election results - Divided bar diagram | Relative Value Chart ...