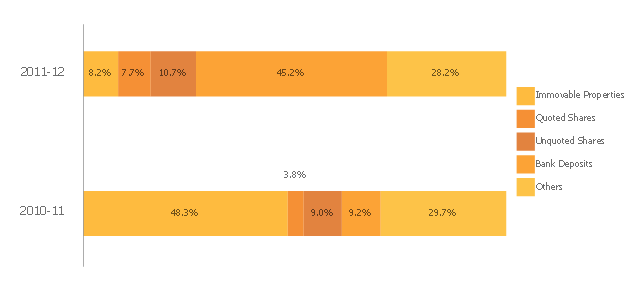
This divided bar diagram sample shows the composition of estates in Hong Kong for 2010-2011 and 2011-2012. It was designed on the base of the figure "Composition of estates" from the website of the Inland Revenue Department of the Government of the Hong Kong Special Administrative Region.
[ird.gov.hk/ dar/ 2011-12/ en/ assessing.html]
"An estate is the net worth of a person at any point in time alive or dead. It is the sum of a person's assets - legal rights, interests and entitlements to property of any kind - less all liabilities at that time. The issue is of special legal significance on a question of bankruptcy and death of the person.
Depending on the particular context, the term is also used in reference to an estate in land or of a particular kind of property (such as real estate or personal estate). The term is also used to refer to the sum of a person's assets only." [Estate (law). Wikipedia]
The divided bar diagram example "Composition of estates" was created using the ConceptDraw PRO diagramming and vector drawing software extended with the Basic Divided Bar Diagrams solution from the Graphs and Charts area of ConceptDraw Solution Park.
Divided bar chart
Pie Chart Software

Prioritization Matrix

 PM Planning
This solution extends ConceptDraw MINDMAP and ConceptDraw Project software, allowing you to automatically create documents that reflect a project's status, for people who have different project roles.
Cause and Effect Analysis


- Composition of estates - Divided bar diagram | Stacked Graph ...
- Subdivided Bar Chart With Example
- How to Draw a Divided Bar Chart in ConceptDraw PRO | Divided ...
- Divided Bar Diagrams | Bar Diagram Math | Bar Diagrams for ...
- Bar Diagram Math | Divided bar diagram - Template | London ...
- Divided Bar Diagrams | How to Draw a Divided Bar Chart in ...
- Divided Bar Diagrams
- How to Draw a Divided Bar Chart in ConceptDraw PRO | Divided ...
- How to Draw a Divided Bar Chart in ConceptDraw PRO | Waterfall ...
- Divided Bar Diagrams
- Real Estate Sales Bar Charts
- Composition Dashboard | Bar Diagrams for Problem Solving. Create ...
- Online Collaboration via Skype | Sales Growth. Bar Graphs Example ...
- How to Draw a Divided Bar Chart in ConceptDraw PRO | Divided ...
- PROBLEM ANALYSIS. Prioritization Matrix | PROBLEM ANALYSIS ...
- PROBLEM ANALYSIS. Root Cause Analysis Tree Diagram | Bar ...
- Composition of estates | Flow Chart For Hk Departmentm
- Authority Matrix Diagram Software | Organogram Software | Bar ...
- How to Create a Bar Chart in ConceptDraw PRO | How to Draw a ...
- Soccer pictograms - Vector stencils library | Bar Graph | Soccer ...