The Best Drawing Program for Mac

Best Multi-Platform Diagram Software

Human Resources
Basic Diagramming


Block Diagram Creator
Best Flowchart Software and Flowchart Symbols

Bubble diagrams in Landscape Design with ConceptDraw DIAGRAM

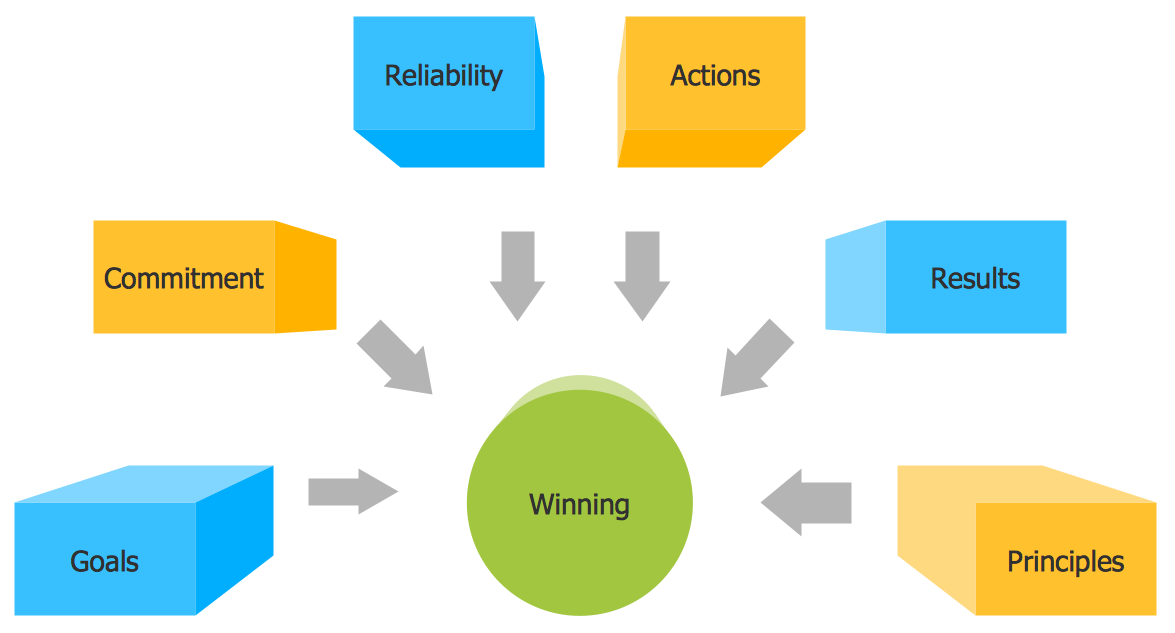
Pyramid Diagram

 Electrical Engineering
This solution extends ConceptDraw DIAGRAM.9.5 (or later) with electrical engineering samples, electrical schematic symbols, electrical diagram symbols, templates and libraries of design elements, to help you design electrical schematics, digital and analog
Blueprint Software
 Entity-Relationship Diagram (ERD)
An Entity-Relationship Diagram (ERD) is a visual presentation of entities and relationships. That type of diagrams is often used in the semi-structured or unstructured data in databases and information systems. At first glance ERD is similar to a flowch
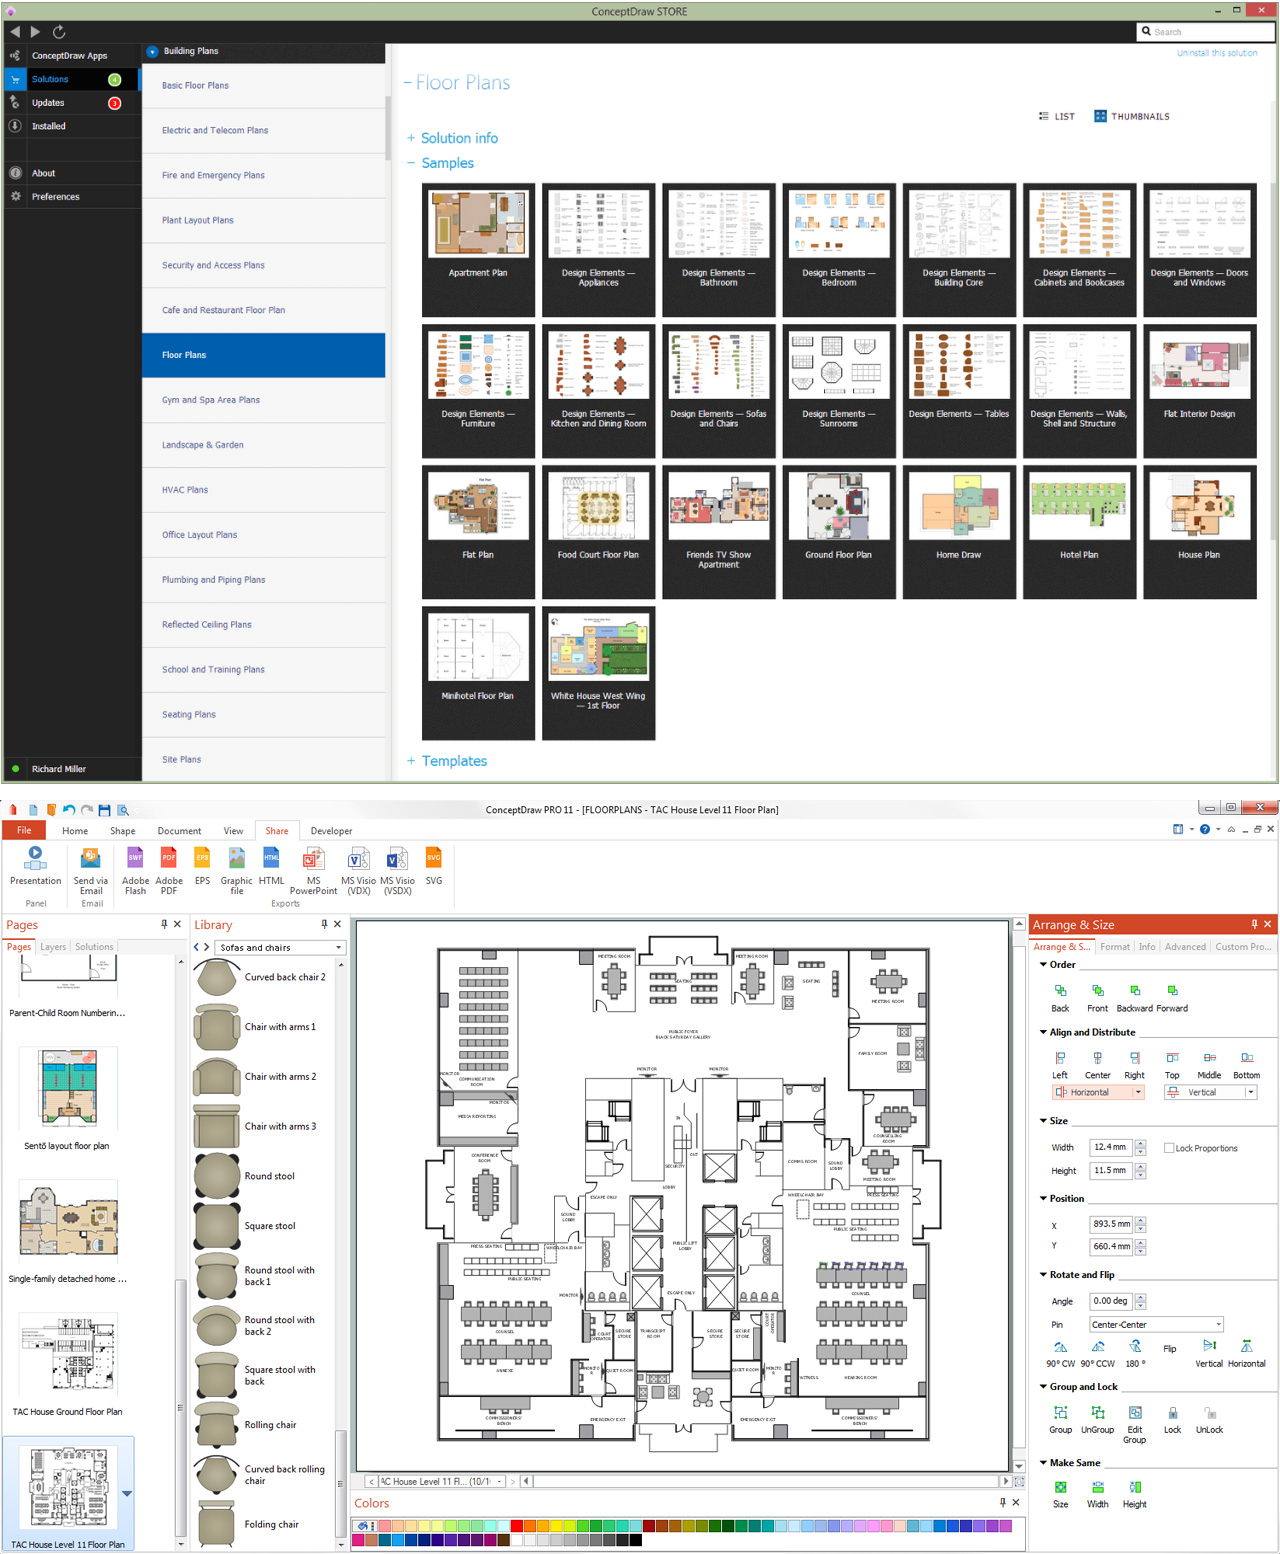
 Office Layout Plans
Office layouts and office plans are a special category of building plans and are often an obligatory requirement for precise and correct construction, design and exploitation office premises and business buildings. Designers and architects strive to make office plans and office floor plans simple and accurate, but at the same time unique, elegant, creative, and even extraordinary to easily increase the effectiveness of the work while attracting a large number of clients.
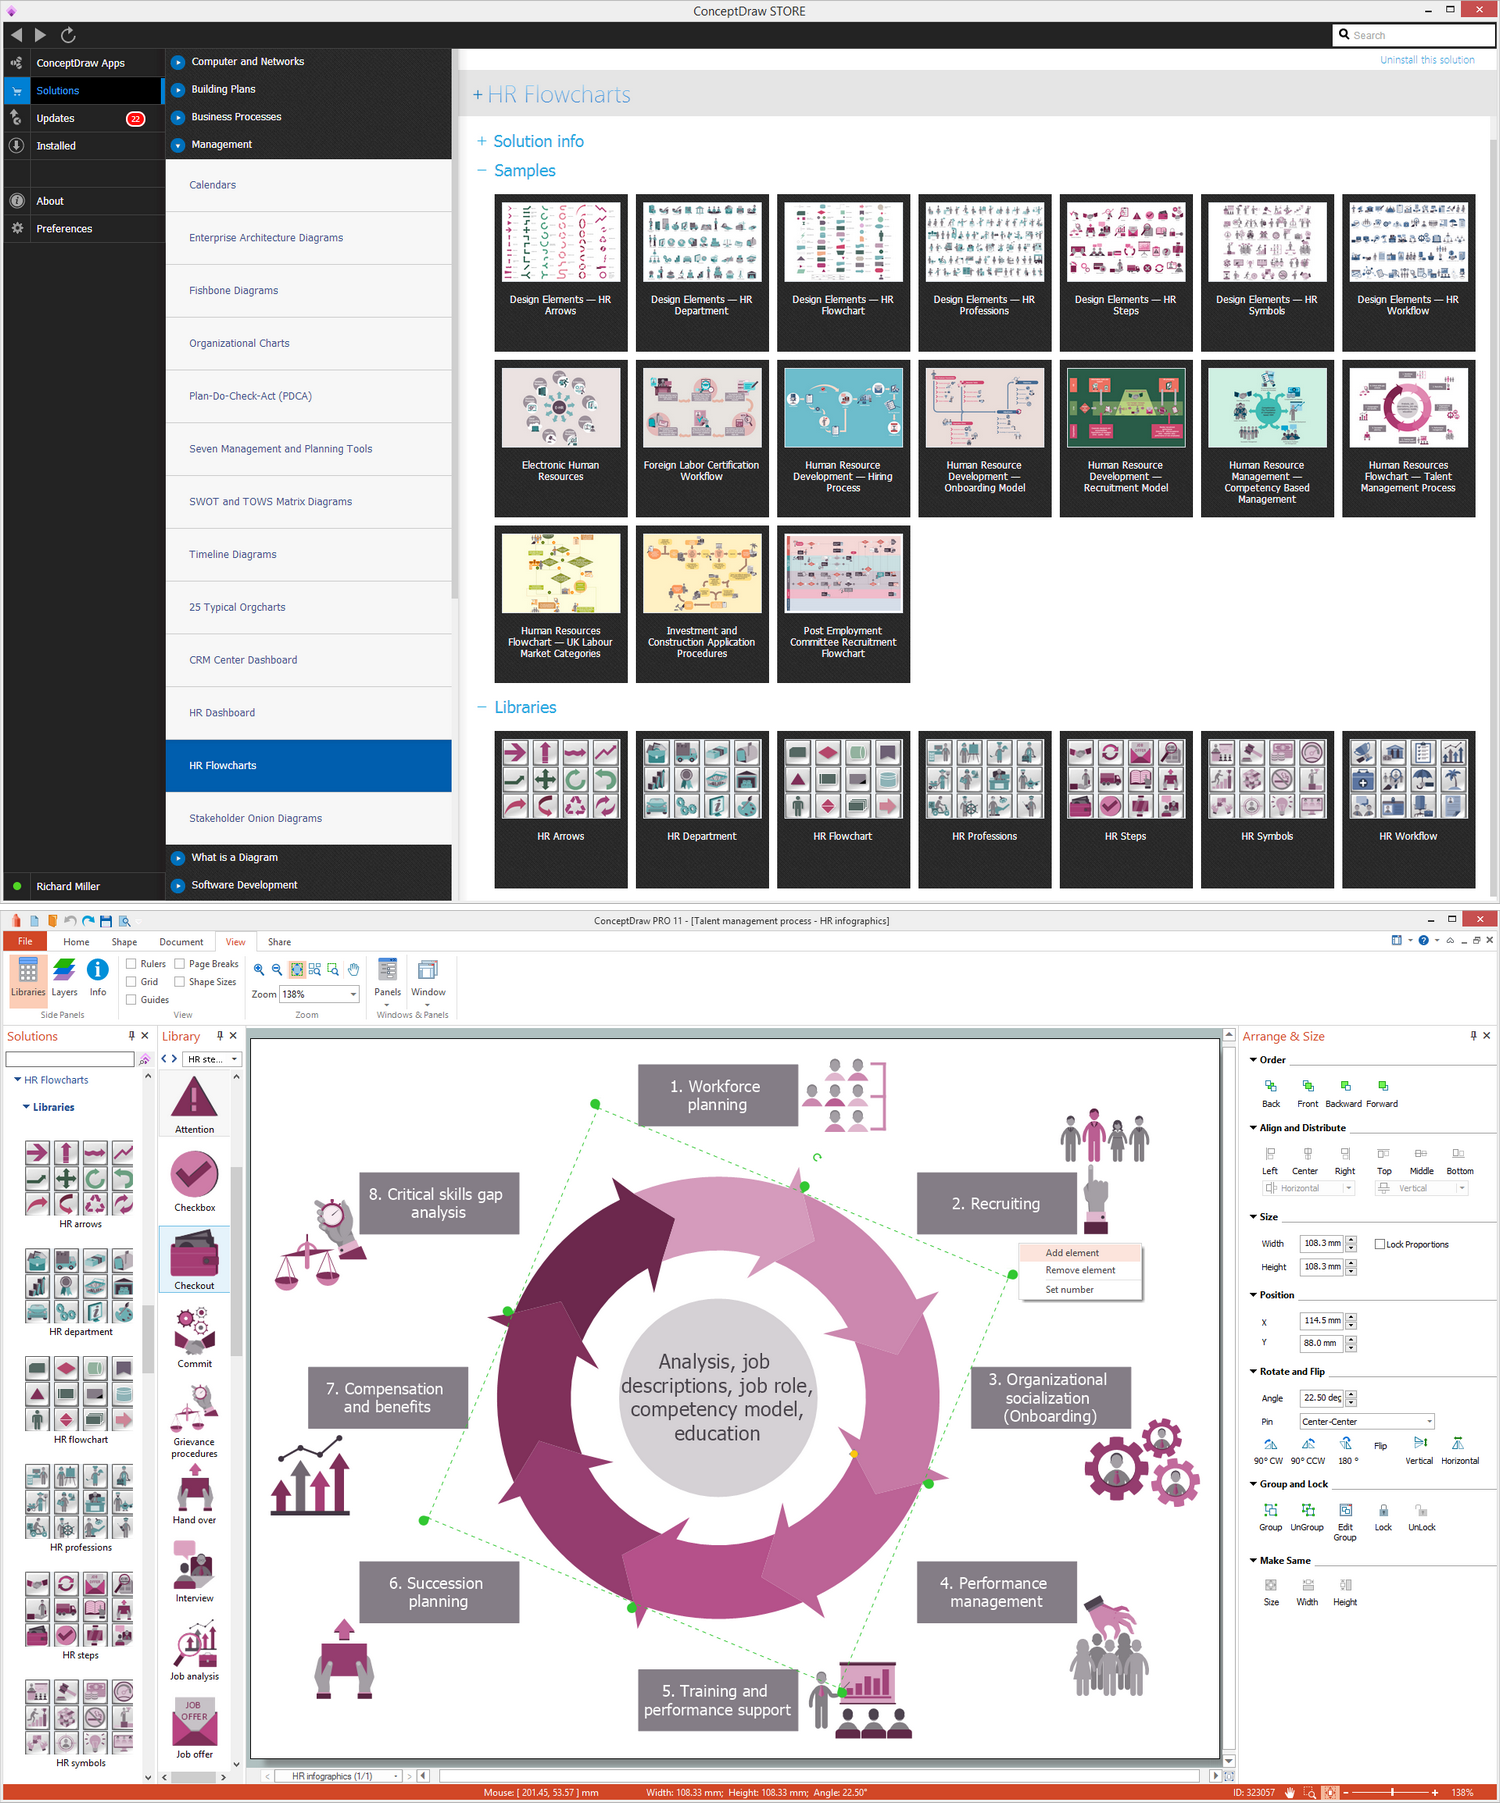
 HR Flowcharts
Human resource management diagrams show recruitment models, the hiring process and human resource development of human resources.
 Venn Diagrams
Venn Diagrams are actively used to illustrate simple set relationships in set theory and probability theory, logic and statistics, mathematics and computer science, linguistics, sociology, and marketing. Venn Diagrams are also often used to visually summarize the status and future viability of a project.
 Rack Diagrams
The Rack Diagrams solution, including a vector stencil library, a collection of samples and a quick-start template, can be useful for all who deal with computer networks. Choosing any of the 54 library's vector shapes, you can design various types of Rack diagrams or Server rack diagrams visualizing 19" rack mounted computers and servers.
- Diagram Of Electronic Library Productivity Chart
- Bar Diagrams for Problem Solving. Create economics and financial ...
- Bar Diagrams for Problem Solving. Create manufacturing and ...
- Process Flowchart | Bar Diagrams for Problem Solving. Create ...
- How Bar Charts Help In Planning Of Industrial Process
- Interior Design Machines and Equipment - Design Elements | Bar ...
- Industrial Floor Diagram
- Process Flowchart | Data Flow Diagram Model | Create Graphs and ...
- Bar Diagrams for Problem Solving. Create manufacturing and ...
- Service 4 Ss fishbone diagram - Template | Fishbone Diagram ...
- Bar Diagrams for Problem Solving. Create manufacturing and ...
- Process Flowchart | Bar Diagrams for Problem Solving. Create ...
- Fishbone Diagram In Industry
- Basic Diagramming | CAD Drawing Software for Making Mechanic ...
- Industry As A System Diagram
- Process Flowchart | Types of Flowcharts | France exports of goods ...
- Process Flowchart | Mechanical Drawing Software | Technical ...
- Plant Layout Plans | Process Flowchart | Bar Diagrams for Problem ...
- Process Flowchart | TQM Diagram Example | Organizational ...
- Service Industry Fishbone Diagram