Bar Diagrams for Problem Solving. Create manufacturing and economics bar charts with Bar Graphs Solution

Bar Chart Template for Word

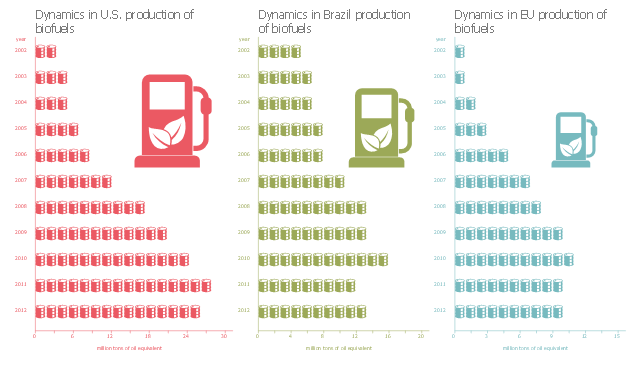
This picture bar graph sample shows biofuels production dynamics in U.S., Brazil and EU from 2002 to 2012. It was designed on the base of the Wikimedia Commons file: Production of biofuels.jpg.
[commons.wikimedia.org/ wiki/ File:Production_ of_ biofuels.jpg]
This file is made available under the Creative Commons CC0 1.0 Universal Public Domain Dedication. [creativecommons.org/ publicdomain/ zero/ 1.0/ deed.en]
"A biofuel is a fuel that is produced through contemporary biological processes, such as agriculture and anaerobic digestion, rather than a fuel produced by geological processes such as those involved in the formation of fossil fuels, such as coal and petroleum, from prehistoric biological matter. Biofuels can be derived directly from plants, or indirectly from agricultural, commercial, domestic, and/ or industrial wastes. Renewable biofuels generally involve contemporary carbon fixation, such as those that occur in plants or microalgae through the process of photosynthesis. Other renewable biofuels are made through the use or conversion of biomass (referring to recently living organisms, most often referring to plants or plant-derived materials). This biomass can be converted to convenient energy-containing substances in three different ways: thermal conversion, chemical conversion, and biochemical conversion. This biomass conversion can result in fuel in solid, liquid, or gas form. This new biomass can also be used directly for biofuels." [Biofuel. Wikipedia]
The pictorial chart example "Production of biofuels" was created using the ConceptDraw PRO diagramming and vector drawing software extended with the Picture Graphs solution from the Graphs and Charts area of ConceptDraw Solution Park.
Image chart
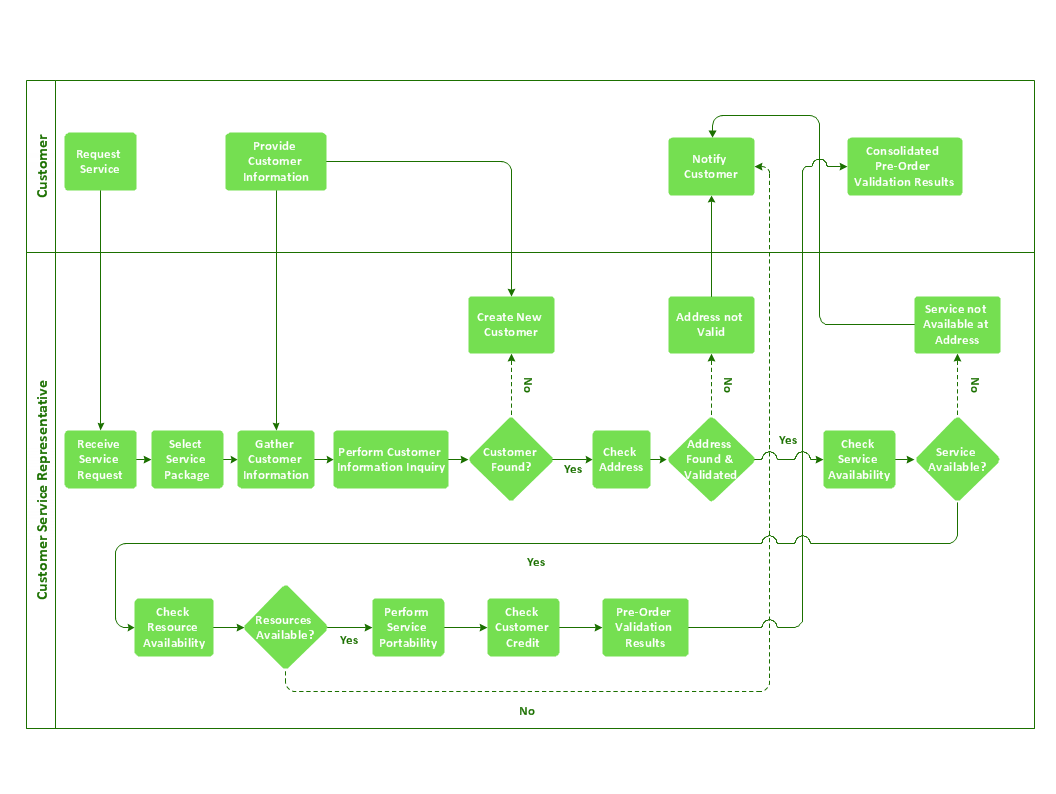
Business Process Flowchart
Best Value — Total Quality Management
Bar Diagram Math

Lean Six Sigma Diagram Software

 Picture Graphs
Typically, a Picture Graph has very broad usage. They many times used successfully in marketing, management, and manufacturing. The Picture Graphs Solution extends the capabilities of ConceptDraw DIAGRAM with templates, samples, and a library of professionally developed vector stencils for designing Picture Graphs.
8 Step Problem Solving

Lean Manufacturing Diagrams

- Bar Chart Of Agriculture Production In India
- Area Charts | Bar Garph Chart Of Crop Production In India
- Area Charts | Bar Graph Of Agriculture In India
- Pictorial Charts Related To Agriculture
- Area Charts | Education Package | Bar Graph Of Indian Agriculture
- Chart Related To Agriculture
- Agricultural Pictorial Chart Images
- Pictorial Chart Related To Agriculture
- Area Charts | Pie Charts Of Agriculture In India
- Flow Chart Of Crops Grown In India