The marketing infogram example "Multi-screen behaviors by type of TV program" was created on the base of data of study "The Multi-Screen Marketer" from the website of the Interactive Advertising Bureau (IAB).
"The Reality (Show) of Multi-Tasking.
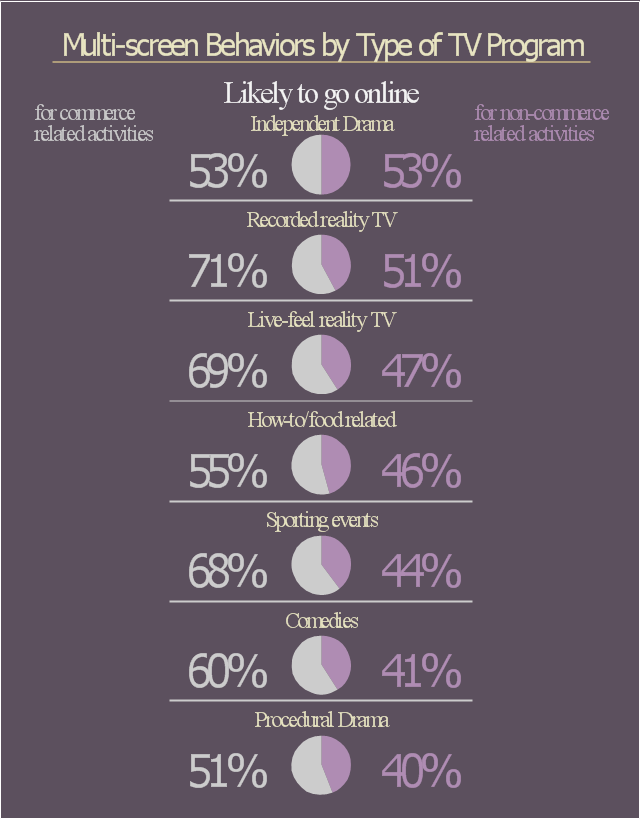
Multi-screen activities while watching TV are very common, but content is not created equal when it comes to our digital distractions. ...
Non-commerce related activities = average of Likely and Very Likely to engage in social activity, searching for information about programming, or general activity (email, surfing, etc.).
Commerce related activities = average of Likely and Very Likely to engage in shopping online and product searches related to programming while watching.
4SCRN respondents are more likely to socialize, shop online and look for information related to what they’re watching than their 2SCRN or 3SCRN peers. For example, 81% of 4SCRN
respondents say they are likely or very likely to go online to surf and email while watching reality TV (examples given in the survey were Jersey Shore, Survivor and The Hills).
Respondents were aware of products. An average of roughly 35% of 3SCRN respondents and over 55% of 4SCRN respondents said it was likely or very likely that they’d search or shop for viewed products while watching.
Recorded reality is, in general, tops for non-commerce related multi-screen activities like social networking on a mobile device. For commerce related multi-screen behaviors, independent dramas win out by a hair." [iab.net/ media/ file/ The_ Multiscreen_ Marketer.pdf]
The marketing infographic example "Multi-screen behaviors by type of TV program" was created using the ConceptDraw PRO diagramming and vector drawing software extended with the Marketing Infographics solition from the area "Business Infographics" in ConceptDraw Solution Park.
"The Reality (Show) of Multi-Tasking.
Multi-screen activities while watching TV are very common, but content is not created equal when it comes to our digital distractions. ...
Non-commerce related activities = average of Likely and Very Likely to engage in social activity, searching for information about programming, or general activity (email, surfing, etc.).
Commerce related activities = average of Likely and Very Likely to engage in shopping online and product searches related to programming while watching.
4SCRN respondents are more likely to socialize, shop online and look for information related to what they’re watching than their 2SCRN or 3SCRN peers. For example, 81% of 4SCRN
respondents say they are likely or very likely to go online to surf and email while watching reality TV (examples given in the survey were Jersey Shore, Survivor and The Hills).
Respondents were aware of products. An average of roughly 35% of 3SCRN respondents and over 55% of 4SCRN respondents said it was likely or very likely that they’d search or shop for viewed products while watching.
Recorded reality is, in general, tops for non-commerce related multi-screen activities like social networking on a mobile device. For commerce related multi-screen behaviors, independent dramas win out by a hair." [iab.net/ media/ file/ The_ Multiscreen_ Marketer.pdf]
The marketing infographic example "Multi-screen behaviors by type of TV program" was created using the ConceptDraw PRO diagramming and vector drawing software extended with the Marketing Infographics solition from the area "Business Infographics" in ConceptDraw Solution Park.
Marketing infogram
How To Create Restaurant Floor Plan in Minutes


DFD Flowchart Symbols

Data Flow Diagram Model

Bubble diagrams in Landscape Design with ConceptDraw PRO

Draw Diagram on Mac

This vector stencils library contains 184 round icons.
Use it to design cloud computing infographics and diagrams with ConceptDraw PRO software.
"Though service-oriented architecture advocates "everything as a service" (with the acronyms EaaS or XaaS or simply aas), cloud-computing providers offer their "services" according to different models, which happen to form a stack: infrastructure-, platform- and software-as-a-service.
Infrastructure as a service (IaaS)
In the most basic cloud-service model ... providers of IaaS offer computers — physical or (more often) virtual machines — and other resources. IaaS refers to online services that abstract the user from the details of infrastructure like physical computing resources, location, data partitioning, scaling, security, backup etc.
Platform as a service (PaaS)
PaaS vendors offer a development environment to application developers. The provider typically develops toolkit and standards for development and channels for distribution and payment. In the PaaS models, cloud providers deliver a computing platform, typically including operating system, programming-language execution environment, database, and web server. Application developers can develop and run their software solutions on a cloud platform without the cost and complexity of buying and managing the underlying hardware and software layers.
Software as a service (SaaS)
In the software as a service (SaaS) model, users gain access to application software and databases. Cloud providers manage the infrastructure and platforms that run the applications. SaaS is sometimes referred to as "on-demand software" and is usually priced on a pay-per-use basis or using a subscription fee.
In the SaaS model, cloud providers install and operate application software in the cloud and cloud users access the software from cloud clients. Cloud users do not manage the cloud infrastructure and platform where the application runs. This eliminates the need to install and run the application on the cloud user's own computers, which simplifies maintenance and support. Cloud applications differ from other applications in their scalability — which can be achieved by cloning tasks onto multiple virtual machines at run-time to meet changing work demand." [Cloud computing. Wikipedia]
The vector stencils library "Cloud round icons" is included in the Cloud Computing Diagrams solution from the Computer and Networks area of ConceptDraw Solution Park.
Add
Analysis
API
App
Archive
Back
Backup
Book
Books
Box
Bug
Calculation
Calendar
Call
Car
CD
Certificate
Cloud alert
Cloud analysis
Cloud authorization
Cloud collaboration
Cloud communications
Cloud computing
Cloud configuration
Cloud connectivity
Cloud control
Cloud cost calculation
Cloud database
Cloud download
Cloud drive
Cloud error
Cloud failure
Cloud FAQ
Cloud feedback
Cloud files
Cloud gateway
Cloud hosting
Cloud info
Cloud Internet storage
Cloud lock
Cloud locked
Cloud mail
Cloud music
Cloud paperless office
Cloud performance
Cloud photo
Cloud safe
Cloud search
Cloud security
Cloud servers
Cloud services
Cloud shopping
Cloud success
Cloud synchronization
Cloud tech support
Cloud transfer
Cloud unlocked
Cloud upload
Cloud video
Code
Collaboration
Communication
Community cloud
Contact list
Content
CPU
Database
Datacenter
Data storage
Desktop
Display
Document
Documents
Dollar
Done
Down
Download
E-commerce
Earth
Email
Encryption
Error
Ethernet
Euro
Failure
Feed
File
Files
Filter
Firewall
Flash drive
Folder
Forward
Hard drive
Hardware
Health
Health monitoring
Home
Hosting
Image
Info
Innovation
Key
Keyboard
Laptop
Letter
Lightning
Link
List
Location
Lock
Log
Login
Logout
Mail
Mail list
Marketplace
Memory (RAM)
Message
Minus
Mobile
Mobile cloud computing
Mouse
Music player
Network
Notebook
Notification
Package
Patch
Performance
Personal cloud
Phone book
Photo
Plug
Pound
Power
Power button
Process
Processing
Puzzles
Question sign
Recovery
Remote
Repair
Restore
Rocket (Logic app)
Router
Safety
Schedule
Script
SDK
Search (Scan)
Security
Server
Server rack
Services
Sharing
Shopping basket
Sign in
Smartphone
Song
Sound
Stethoscope
Stickman
Subscription
Sync
Tablet
Tech support
Time
Top rated
Transfer
Unlink
Unlock
Up
Upload
User
Video mail
View (visual)
Virus protection
Waste bin
Web
Wifi
Wireless
Yen sign
Building Plans with ConceptDraw PRO
- Cloud round icons - Vector stencils library | Contactlist Background ...
- People pictograms - Vector stencils library | People pictograms ...
- People pictograms - Vector stencils library | Presentation design ...
- How To Draw Building Plans | Property Management Examples ...
- Music Background
- Arched Line Vector
- Books Background Design
- Online Shopping Export Shipping Flowchart
- Music Vector Background
- Sales Process Flowcharts | E-Filing general workflow | Online store ...
- Marketing - Vector stencils library | Presentation design elements ...
- Education pictograms - Vector stencils library | Presentation design ...
- Notebook Transparent Background
- Arrows - Vector clipart library | Presentation Clipart | Illustration ...
- Logo For Books Library Without Background
- Arrows - Vector clipart library | Presentation Clipart | Circular Arrows ...
- Arrows - Vector clipart library | Presentation design elements ...
- Concept Maps | How To Make a Concept Map | Concept Map Maker ...
- Presentation Clipart | Business People Clipart | Arrows - Vector ...
- Sales symbols - Vector stencils library | Packaging, loading, customs ...