The vector stencils library "Management pictograms" contains 72 management pictograms.
Use it to create your management infogram in the ConceptDraw PRO diagramming and vector drawing software.
The flat icons example "Management pictograms - Vector stencils library" is included in the solution "Marketing infographics" from the "Business infographics" area of ConceptDraw Solution Park.
Use it to create your management infogram in the ConceptDraw PRO diagramming and vector drawing software.
The flat icons example "Management pictograms - Vector stencils library" is included in the solution "Marketing infographics" from the "Business infographics" area of ConceptDraw Solution Park.
Accounting management

Activity

Audit management

Board of directors

Budget

Business managemen

Business management tools

Business model

Commanding

Communication

Company

Contract management

Controlling

Coordinating

Core competencies

Corporate strategy

Creativity

Crisis management

Crisis management 2

Decision making

Environmental management

Expenses

External environment

Financial management

Financial management 2

Financial planning

First-level manager

Goal

HR management

Investment management

IT management

Knowledge management

Knowledge management 2

Leadership

Macro environment

Management system

Managerial accounting

Manufacturing management

Market orientation

Marketing management

Marketing strategy

Middle-level manager

Mission

Objectives

Operations management

Organizing

Performance

Performance management

Planning

Policy

PR management

Problem solving

Process management

Product management

Profit

Profit 2

Project management

Quality management

Research and development

Resource management

Resources

Risk management

Sales manegment

Service management

Stakeholder management

Strategic management

Strategic planning

Technology management

Time frame

Time management

Top-level manager

Vision

The vector stencils library "Management pictograms" contains 72 management pictograms.
Use it to create your management infogram in the ConceptDraw PRO diagramming and vector drawing software.
The flat icons example "Management pictograms - Vector stencils library" is included in the solution "Marketing infographics" from the "Business infographics" area of ConceptDraw Solution Park.
Use it to create your management infogram in the ConceptDraw PRO diagramming and vector drawing software.
The flat icons example "Management pictograms - Vector stencils library" is included in the solution "Marketing infographics" from the "Business infographics" area of ConceptDraw Solution Park.
Accounting management
Activity
Audit management
Board of directors
Budget
Business managemen
Business management tools
Business model
Commanding
Communication
Company
Contract management
Controlling
Coordinating
Core competencies
Corporate strategy
Creativity
Crisis management
Crisis management 2
Decision making
Environmental management
Expenses
External environment
Financial management
Financial management 2
Financial planning
First-level manager
Goal
HR management
Investment management
IT management
Knowledge management
Knowledge management 2
Leadership
Macro environment
Management system
Managerial accounting
Manufacturing management
Market orientation
Marketing management
Marketing strategy
Middle-level manager
Mission
Objectives
Operations management
Organizing
Performance
Performance management
Planning
Policy
PR management
Problem solving
Process management
Product management
Profit
Profit 2
Project management
Quality management
Research and development
Resource management
Resources
Risk management
Sales manegment
Service management
Stakeholder management
Strategic management
Strategic planning
Technology management
Time frame
Time management
Top-level manager
Vision
Fishbone Diagram Procedure

HR Management Software

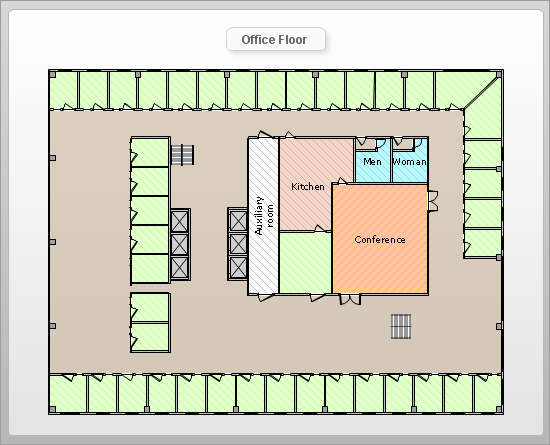
Building Drawing Software for Design Office Layout Plan


Interior Design Office Layout Plan Design Element

Building Drawing Design Element: Office Layout Plan

How To Create Floor Plans
This circle-spoke diagram sample shows how leadership and data provide essential coordination of other functions in an asset management environment. Leadership points the way and common data systems keep all divisions communicating effectively.
This circle-spoke diagram example was created on the base of illustration of article "Beyond the Short Term: Transportation Asset Management for Long-Term Sustainability, Accountability and Performance" from the website of The Federal Highway Administration (FHWA).
[fhwa.dot.gov/ asset/ 10009/ tam_ topr806_ 3.cfm]
"Asset management, broadly defined, refers to any system that monitors and maintains things of value to an entity or group. It may apply to both tangible assets such as buildings and to intangible concepts such as intellectual property and goodwill. Asset management is a systematic process of operating, maintaining, upgrading, and disposing of assets cost-effectively. Alternative views of asset management in the engineering environment are: the practice of managing assets to achieve the greatest return (particularly useful for productive assets such as plant and equipment), and the process of monitoring and maintaining facilities systems, with the objective of providing the best possible service to users (appropriate for public infrastructure assets)." [Asset management. Wikipedia]
The hub-and-spoke diagram example "Leadership and data" was created using the ConceptDraw PRO diagramming and vector drawing software extended with the Circle-Spoke Diagrams solution from the area "What is a Diagram" of ConceptDraw Solution Park.
Circle-spoke diagram

ConceptDraw PRO Compatibility with MS Visio

Office Design Software

Office Layout

Floor Plan

 Circle-Spoke Diagrams
Examples of subject areas that are well suited to this approach are marketing, business, products promotion, process modeling, market, resource, time, and cost analysis. Circle-Spoke Diagrams are successfully used in presentations, conferences, management documents, magazines, reportages, reviews, reports, TV, and social media.
Pie Chart Word Template. Pie Chart Examples

- Management pictograms - Vector stencils library | Management ...
- Management pictograms - Vector stencils library | How To use ...
- Management pictograms - Vector stencils library | Design elements ...
- PDCA cycle | Project management - Vector stencils library ...
- Management pictograms - Vector stencils library | Management ...
- Management pictograms - Vector stencils library | Wireless Network ...
- Management pictograms - Vector stencils library | Marketing Area ...
- System And Asset Management Uml Diagrams
- Management pictograms - Vector stencils library | How To Show ...
- Uml Diagrams Solution Asset Management System
- Intellectual Vector Png
- Management pictograms - Vector stencils library | HR symbols ...
- Transport map template | Maps | Rail transport - Vector stencils ...
- Investment Png
- Management pictograms - Vector stencils library | Quality ...
- Flow Chart Of Assets Management System
- Block Diagram Of Asset Management System
- Asset Management Software Architecture
- Management pictograms - Vector stencils library
- Vector Diagram Of Strategic Management