"Consumption of energy resources, (e.g. turning on a light) requires resources and has an effect on the environment. Many electric power plants burn coal, oil or natural gas in order to generate electricity for energy needs. While burning these fossil fuels produces a readily available and instantaneous supply of electricity, it also generates air pollutants including carbon dioxide (CO2), sulfur dioxide and trioxide (SOx) and nitrogen oxides (NOx). Carbon dioxide is an important greenhouse gas which is thought to be responsible for some fraction of the rapid increase in global warming seen especially in the temperature records in the 20th century, as compared with tens of thousands of years worth of temperature records which can be read from ice cores taken in Arctic regions. Burning fossil fuels for electricity generation also releases trace metals such as beryllium, cadmium, chromium, copper, manganese, mercury, nickel, and silver into the environment, which also act as pollutants.
The large-scale use of renewable energy technologies would "greatly mitigate or eliminate a wide range of environmental and human health impacts of energy use". Renewable energy technologies include biofuels, solar heating and cooling, hydroelectric power, solar power, and wind power. Energy conservation and the efficient use of energy would also help." [Energy industry. Environmental impact. Wikipedia]
The Energy resources diagram example was created in the ConceptDraw PRO diagramming and vector drawing software using the Manufacturing and Maintenance solution from the Illustration area of ConceptDraw Solution Park.
Infographics

 Chemical and Process Engineering
This chemical engineering solution extends ConceptDraw DIAGRAM.9.5 (or later) with process flow diagram symbols, samples, process diagrams templates and libraries of design elements for creating process and instrumentation diagrams, block flow diagrams (BFD
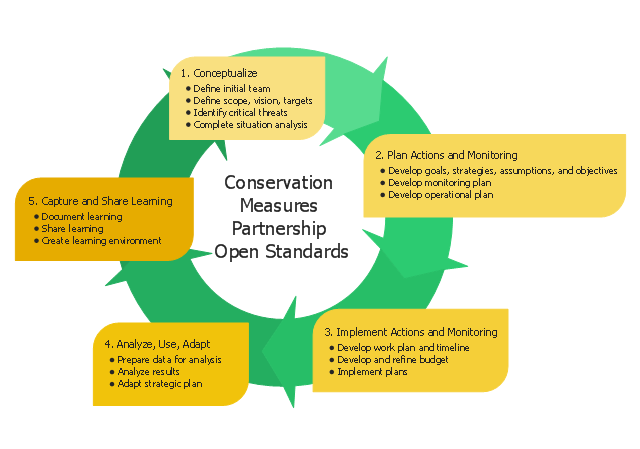
This circular arrows diagram sample shows five steps of the Conservation Measures Partnership (CMP) adaptive management cycle. It was designed on the base of the Wikimedia Commons file: CMP Cycle - 2008-02-20.jpg.
[commons.wikimedia.org/ wiki/ File:CMP_ Cycle_ -_ 2008-02-20.jpg]
"Adaptive management (AM), also known as adaptive resource management (ARM), is a structured, iterative process of robust decision making in the face of uncertainty, with an aim to reducing uncertainty over time via system monitoring. In this way, decision making simultaneously meets one or more resource management objectives and, either passively or actively, accrues information needed to improve future management. Adaptive management is a tool which should be used not only to change a system, but also to learn about the system. Because adaptive management is based on a learning process, it improves long-run management outcomes. The challenge in using the adaptive management approach lies in finding the correct balance between gaining knowledge to improve management in the future and achieving the best short-term outcome based on current knowledge.
Application to environmental projects and programs.
Open Standards for the Practice of Conservation lay out 5 main steps to an adaptive management project cycle." [Adaptive management. Wikipedia]
The diagram example "CMP adaptive management cycle" was created using the ConceptDraw PRO diagramming and vector drawing software extended with the Circular Arrows Diagrams solution from the area "What is a Diagram" of ConceptDraw Solution Park.
Circular arrows diagram
Used Solutions
 Business Diagrams
The Business Diagrams Solution extends ConceptDraw DIAGRAM with an extensive collection of professionally designed illustrative samples and a wide variety of vector stencils libraries, which are the real help for all business-related people, business analysts, business managers, business advisers, marketing experts, PR managers, knowledge workers, scientists, and other stakeholders allowing them to design the bright, neat, expressive and attractive Bubble Diagrams, Circle-Spoke Diagrams, Circular Arrows Diagrams, and Venn Diagrams with different quantity of sets in just minutes; and then successfully use them in documents, reports, statistical summaries, and presentations of any style.
 Health Sciences
Health Sciences solution including professionally designed samples and wide range of high-quality vector icons and pictograms of basic medical sciences, surgery specializations, internal medicine, medical diagnostics, interdisciplinary fields, mental health, obstetrics and gynecology, public health, allied health, and other medical specialties, is a perfect assistant in drawing Health diagrams, schematics, illustrations, infographics and slides for presentations on the healthcare, medical and health sciences thematic, in development knowledge in health science, in studying and representing the physical, mental and social aspects of human health, in determining the role of different health sciences at this process, finding and explaining new methods of treatment different diseases, making an overview and describing the main characteristics of health sciences in a visual form.
 Health Package
Health Package is a set of multifaceted solutions intended for visualization and illustration in a field of medicine and health, for drawing colorful, interesting and precise illustrations and infographics that will be used successfully in medical documents, articles, special magazines, posters, billboards, websites, presentations, collages. Having these solutions available, it will not be difficult to illustrate the medical editions, to convey the information in a full and interesting form, to teach students with use effective visual methods, to describe the medical facts, to tell about innovations in a field of medicine, health and correct nutrition, to explain the causes and consequences of different diseases, as well as the measures of their prevention and treatment.
- Analysis Of Graps Pie Chart Of Conservation Of Natural Resources
- Analysis On Conservation Of Natural Resources With Diagram
- Conservation Of Natural Resources Analysis Explanation
- Energy resources diagram | Conservation Of Natural Resources ...
- Pie Chart On Natural Resources
- Conservation Of Natural Resources Bar Graph And Pie Diagram
- How To Make A Chart On Conservation Of Natural Resources
- Natural Resources Pie Chart
- Pie Chart Of Conservation Of Natural Resources
- Conservation Of Resources Charts
- Conservation Of Natural Resources Drawing
- Graph Observation Of Conservation Of Natural Resources
- Diagrams Of Natural Resources
- Natural Resources Graph
- Pie Daigram On Natural Resources
- Natural Resources Pie Chart And Bar Graph
- Pie Chart For Conservation Of Natural Resources
- Resources and energy - Vector stencils library | Chemistry Drawings ...
- Energy resources diagram | Resources and energy - Vector stencils ...
- Energy resources diagram | Target and Circular Diagrams | How to ...