Activity on Node Network Diagramming Tool

Emergency Action Plan Template

Network Analysis Activity on Node
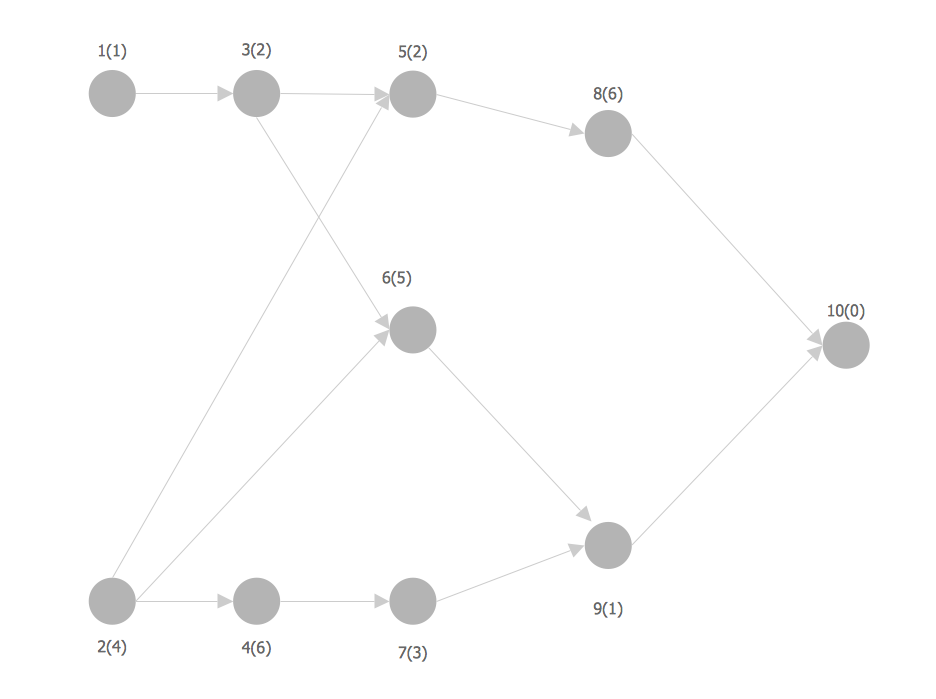
The PERT chart shows the logical connections and consequence of a set of tasks. PERT charts the time period for problem solving and the implementation plan for all activities along the critical path. The PERT chart is also known as a precedence diagram or project network diagram.
"The Program (or Project) Evaluation and Review Technique, commonly abbreviated PERT, is a statistical tool, used in project management, that is designed to analyze and represent the tasks involved in completing a given project. ...
PERT is a method to analyze the involved tasks in completing a given project, especially the time needed to complete each task, and to identify the minimum time needed to complete the total project.
PERT was developed primarily to simplify the planning and scheduling of large and complex projects. ...
A network diagram can be created by hand or by using diagram software. There are two types of network diagrams, activity on arrow (AOA) and activity on node (AON). Activity on node diagrams are generally easier to create and interpret." [Program Evaluation and Review Technique. Wikipedia]
The PERT chart is one of the Seven Management and Planning Tools (7 MP tools, Seven New Quality Tools).
The PERT chart template for the ConceptDraw PRO diagramming and vector drawing software is included in the solution "Seven Management and Planning Tools" from the Management area of ConceptDraw Solution Park.
PERT chart template

Legend

How to Create Presentation of Your Project Gantt Chart

Entity-Relationship Diagram (ERD) with ConceptDraw DIAGRAM


Activity Network Diagram Method

UML Tool & UML Diagram Examples

Prioritization Matrix

Critical Path Method in ConceptDraw PROJECT

- PERT chart - Template | Activity On Node Diagram Template
- Activity on Node Network Diagramming Tool | Network Analysis ...
- Project Management Net Work Diagram Activity On Node
- Graphic Technologies | Activity Network Diagram
- Activity on Node Network Diagramming Tool | PERT chart ...
- PERT chart - Template | Activity On Arrow Diagram Generator
- Activity on Node Network Diagramming Tool
- Activity On Node Network Diagram
- Activity Chart Template
- Activity Network Diagram Method | Project Timeline | Draw Network ...