Activity on Node Network Diagramming Tool

Program Evaluation and Review Technique (PERT) with ConceptDraw DIAGRAM

Basic Flowchart Symbols and Meaning


UML Activity Diagram

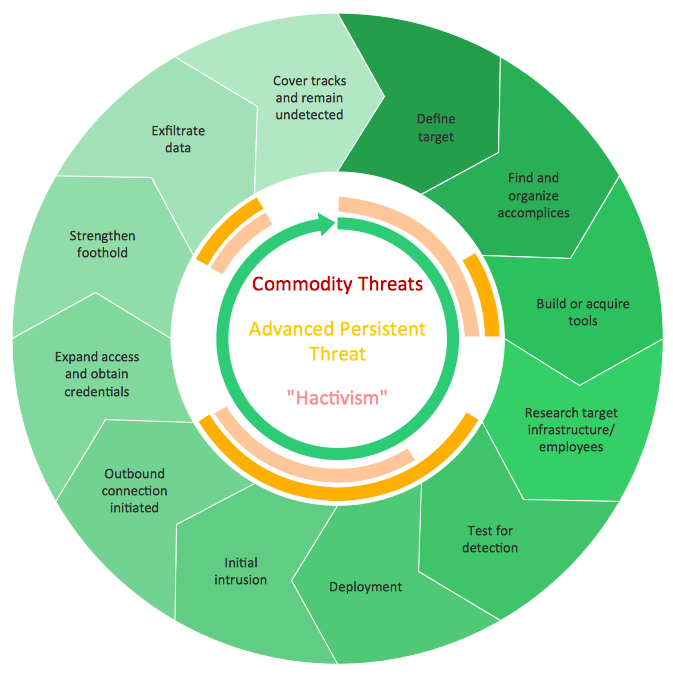
Circular Arrows


Examples of Flowcharts, Org Charts and More


Entity Relationship Diagram Symbols

IDEF0 standard with ConceptDraw DIAGRAM

 Event-driven Process Chain Diagrams
Event-Driven Process Chain Diagrams solution extends ConceptDraw DIAGRAM functionality with event driven process chain templates, samples of EPC engineering and modeling the business processes, and a vector shape library for drawing the EPC diagrams and EPC flowcharts of any complexity. It is one of EPC IT solutions that assist the marketing experts, business specialists, engineers, educators and researchers in resources planning and improving the business processes using the EPC flowchart or EPC diagram. Use the EPC solutions tools to construct the chain of events and functions, to illustrate the structure of a business process control flow, to describe people and tasks for execution the business processes, to identify the inefficient businesses processes and measures required to make them efficient.
- PERT chart - Template | Activity On Arrow Diagram Generator
- Draw Activity On Arrow Diagram Online
- Arrow Diagram Example
- Diagramming Software for Design UML Activity Diagrams | UML ...
- Activity Network (PERT) Chart | Activity Network Diagram Method ...
- Drawing Activity On Arc Network Arrow Diagram Algorithm
- Free Gantt Chart Template With Network Arrows
- Activity on Node Network Diagramming Tool | Network Analysis ...
- IDEF0 Visio | UML Activity Diagram | UML Class Diagram ...