Process Flowchart


The vector stencils library "Bank UML activity diagram" contains 32 shapes of UML activity diagram.
Use it for object-oriented modeling of your bank information system.
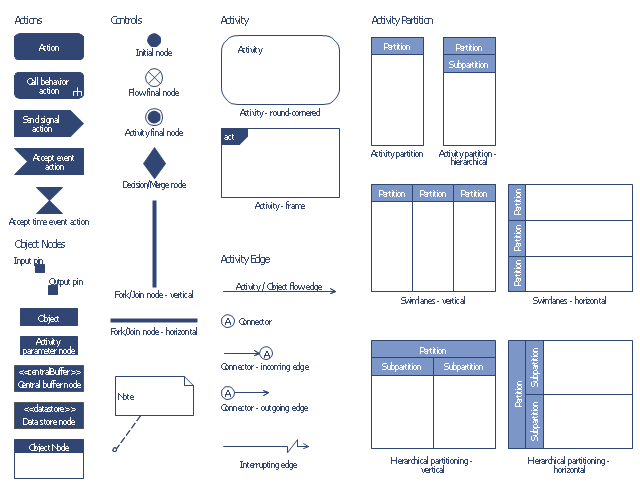
"Activity diagrams are constructed from a limited number of shapes, connected with arrows. The most important shape types:
* rounded rectangles represent actions;
* diamonds represent decisions;
* bars represent the start (split) or end (join) of concurrent activities;
* a black circle represents the start (initial state) of the workflow;
* an encircled black circle represents the end (final state).
Arrows run from the start towards the end and represent the order in which activities happen.
Activity diagrams may be regarded as a form of flowchart. Typical flowchart techniques lack constructs for expressing concurrency. However, the join and split symbols in activity diagrams only resolve this for simple cases; the meaning of the model is not clear when they are arbitrarily combined with decisions or loops.
While in UML 1.x, activity diagrams were a specialized form of state diagrams, in UML 2.x, the activity diagrams were reformalized to be based on Petri net-like semantics, increasing the scope of situations that can be modeled using activity diagrams. These changes cause many UML 1.x activity diagrams to be interpreted differently in UML 2.x." [Activity diagram. Wikipedia]
This example of UML activity diagram symbols for the ConceptDraw PRO diagramming and vector drawing software is included in the ATM UML Diagrams solution from the Software Development area of ConceptDraw Solution Park.
Use it for object-oriented modeling of your bank information system.
"Activity diagrams are constructed from a limited number of shapes, connected with arrows. The most important shape types:
* rounded rectangles represent actions;
* diamonds represent decisions;
* bars represent the start (split) or end (join) of concurrent activities;
* a black circle represents the start (initial state) of the workflow;
* an encircled black circle represents the end (final state).
Arrows run from the start towards the end and represent the order in which activities happen.
Activity diagrams may be regarded as a form of flowchart. Typical flowchart techniques lack constructs for expressing concurrency. However, the join and split symbols in activity diagrams only resolve this for simple cases; the meaning of the model is not clear when they are arbitrarily combined with decisions or loops.
While in UML 1.x, activity diagrams were a specialized form of state diagrams, in UML 2.x, the activity diagrams were reformalized to be based on Petri net-like semantics, increasing the scope of situations that can be modeled using activity diagrams. These changes cause many UML 1.x activity diagrams to be interpreted differently in UML 2.x." [Activity diagram. Wikipedia]
This example of UML activity diagram symbols for the ConceptDraw PRO diagramming and vector drawing software is included in the ATM UML Diagrams solution from the Software Development area of ConceptDraw Solution Park.
UML activity diagram symbols
UML Activity Diagram

UML Activity Diagram. Design Elements
")

 IDEF0 Diagrams
IDEF0 Diagrams visualize system models using the Integration Definition for Function Modeling (IDEF) methodology. Use them for analysis, development and integration of information and software systems, and business process modelling.
 Pyramid Diagrams
Pyramid Diagrams solution extends ConceptDraw PRO software with templates, samples and library of vector stencils for drawing the marketing pyramid diagrams.
 Event-driven Process Chain Diagrams
Event-driven Process Chain (EPC) Diagram is a type of flowchart widely used for modeling in business engineering and reengineering, business process improvement, and analysis. EPC method was developed within the Architecture of Integrated Information Systems (ARIS) framework.
Credit Card Processing System UML Diagram

Workflow Diagram Symbols

Design Elements for UML Diagrams

Model Based Systems Engineering

UML Diagram

UML Deployment Diagram Example - ATM System UML diagrams

Quality Management System

UML Sample Project

- Activity Diagrams For Library Information Systems
- Activity Diagram For Member Registration In Library System
- Diagram Of Library System Activity
- Library Information System Use Case Diagram
- Activity Diagram For Library System
- Activity Diagram Of A Library System
- Activity Diagram For Library Management
- Use Case Diagram Of Library Information System
- UML Activity Diagram | Diagramming Software for Design UML ...
- Bank Activity Diagram
- Usecase Diagram For A Library Information System
- Activity Diagram For Library Management System In Uml
- Show The Activity Diagram In Library Management System
- Activity Diagram Of Library Management System Swimlanes
- Activity Diagram With Swimlanes Of Library
- Sequence Diagram For Library Information System
- Activity Diagram With Swimlane For Library Management
- UML Diagram | Design Elements for UML Diagrams | UML Diagram ...
- Swim Lane Diagrams | Swim Lane Flowchart Symbols | UML Activity ...