Material Requisition Flowchart. Flowchart Examples

Accounting Flowchart Purchasing Receiving Payable and Payment

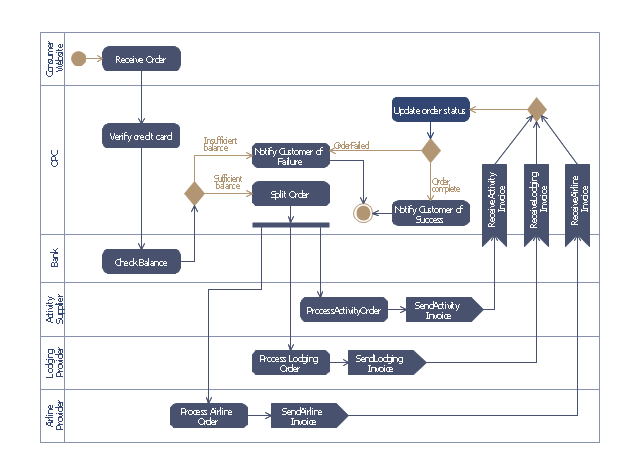
This purchase order processing UML activity diagram was created on the base of activity diagram from the software architecture documentation wiki of the Software Engineering Institute (SEI) of Carnegie Mellon University (CMU).
[wiki.sei.cmu.edu/ sad/ index.php/ Image:PurchaseOrderActivityDiagram.png]
"A purchase order (PO) is a commercial document and first official offer issued by a buyer to a seller, indicating types, quantities, and agreed prices for products or services. Acceptance of a purchase order by a seller forms a contract between the buyer and seller, so no contract exists until the purchase order is accepted. It is used to control the purchasing of products and services from external suppliers.
Creating a purchase order is typically the first step of the purchase to pay process in an ERP system." [Purchase order. Wikipedia]
This purchase order processing UML activity diagram example was created using the ConceptDraw PRO diagramming and vector drawing software extended with the ATM UML Diagrams solution from the Software Development area of ConceptDraw Solution Park.
UML activity diagram of purchase order processing
The vector stencils library "Stakeholder icons" contains 41 icons for drawing onion diagrams.
Use it with ConceptDraw PRO software to design your stakeholder diagrams.
"A stakeholder or stakeholders, as defined in its first usage in a 1963 internal memorandum at the Stanford Research Institute, are "those groups without whose support the organization would cease to exist." The theory was later developed and championed by R. Edward Freeman in the 1980s. Since then it has gained wide acceptance in business practice and in theorizing relating to strategic management, corporate governance, business purpose and corporate social responsibility (CSR). A corporate stakeholder can affect or be affected by the actions of a business as a whole.
The term has been broadened to include anyone who has an interest in a matter." [Stakeholder (corporate). Wikipedia]
The icon set example "Design elements - Stakeholder icons" is included in the Stakeholder Onion Diagrams solution from the Management area of ConceptDraw Solution Park.
Icon set for onion diagrams
Gane Sarson Diagram

This AV connector pinout diagram example was redesigned from the Wikipedia file: DVI Connector Types.svg.
[en.wikipedia.org/ wiki/ File:DVI_ Connector_ Types.svg]
"Digital Visual Interface (DVI) is a video display interface developed by the Digital Display Working Group (DDWG). The digital interface is used to connect a video source to a display device, such as a computer monitor. It was developed with the intention of creating an industry standard for the transfer of digital video content.
The interface is designed to transmit uncompressed digital video and can be configured to support multiple modes such as DVI-D (digital only), DVI-A (analog only), or DVI-I (digital and analog). Featuring support for analog connections, the DVI specification is compatible with the VGA interface. This compatibility, along with other advantages, led to its widespread acceptance over competing digital display standards Plug and Display (P&D) and Digital Flat Panel (DFP). Although DVI is predominantly associated with computers, it is sometimes used in other consumer electronics such as television sets, video game consoles and DVD players." [Digital Visual Interface. Wikipedia]
The example "DVI connector types" was created using the ConceptDraw PRO diagramming and vector drawing software extended with the Audio and Video Connectors solution from the Engineering area of ConceptDraw Solution Park.
Male DVI connector pins (view of plug)
-dvi-connector-types.png--diagram-flowchart-example.png)
The vector stencils library "Scrum workspace" contains 21 icons.
Use this clipart set to design your agile software development diagrams and infographics with ConceptDraw PRO software.
"... a list of all the things that ... should be visible within the ideal agile workspace:
Big Visible Charts. ... the sprint burndown chart, showing the number of hours remaining as of each day of the current sprint. ... big visible charts showing the number of passing customer acceptance tests, the pass/ fail status of tests by day, sprint and release burndown charts, number of new stories introduced to the product backlog per sprint, and more.
Additional feedback devices. In addition to big, visible charts, it is common for an agile team to use additional visual feedback devices in their workspace. One of the most common is a lava lamp that is turned on whenever the automated build is broken.
... flashing red traffic lights to indicate exceptional conditions such as an issue on a production server. Also popular are ambient orbs and Nabaztag rabbits, which are wireless programmable devices that can also be configured to change colors, speak messages, or wiggle their ears as a team desires. ...
Everyone on your team. Each person on the team should ideally be able to see each other person on the team. This absolutely includes the ScrumMaster and ideally includes the product owner. ...
The sprint backlog. One of the best ways to ensure that everything necessary is completed in the sprint is to make the sprint backlog visible. The best way to do that is by displaying the sprint backlog on a wall, ideally in the form of a task board ...
The product backlog. One problem with running an endless series of sprints is that each can feel disconnected or isolated from the whole of a planned released or related set of new capabilities. A good way to reduce the impact of this problem is by displaying the product backlog somewhere clearly visible. ... tack the index cards with those upcoming user stories on a wall where all can see them. This allows team members to see how the user stories they are working on in the current sprint relate to others that are coming soon.
At least one big white board. ... Locating this in the team’s common workspace encourages spontaneous meetings." [mountaingoatsoftware.com/ blog/ the-ideal-agile-workspace]
The clip art sample "Design elements - Scrum workspace" is included in the Scrum solution from the Project Management area of ConceptDraw Solution Park.
Icon set
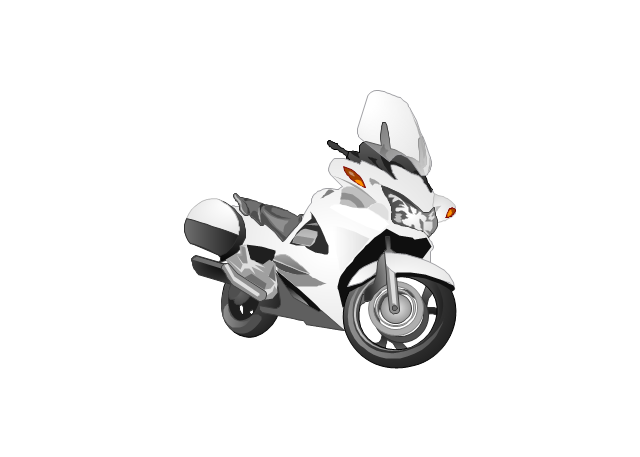
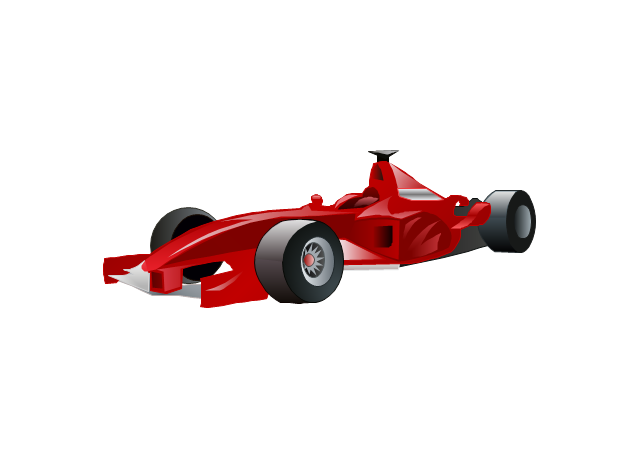
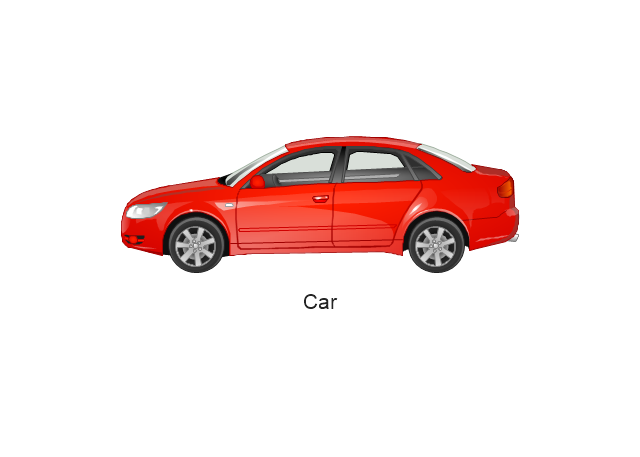
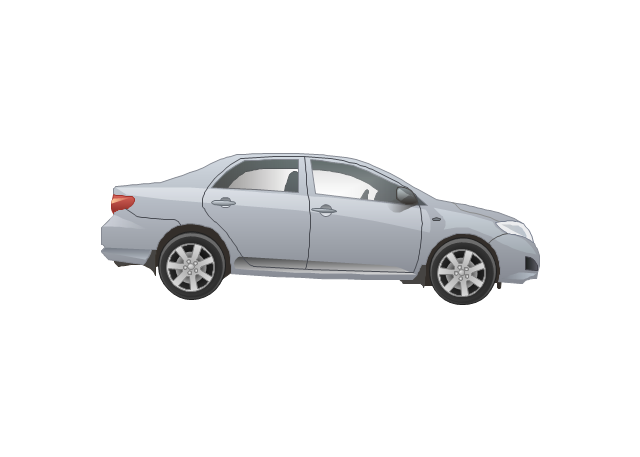
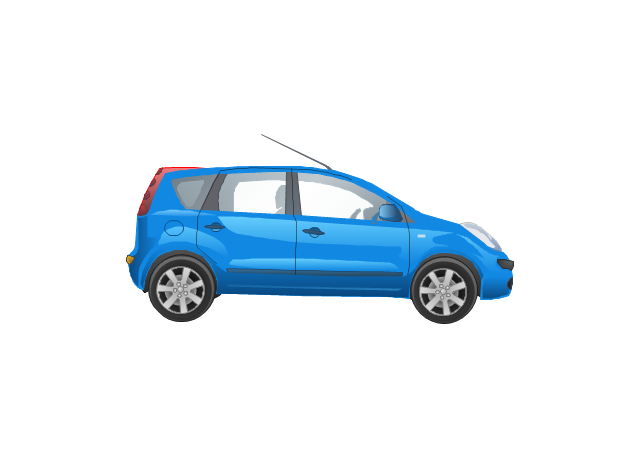
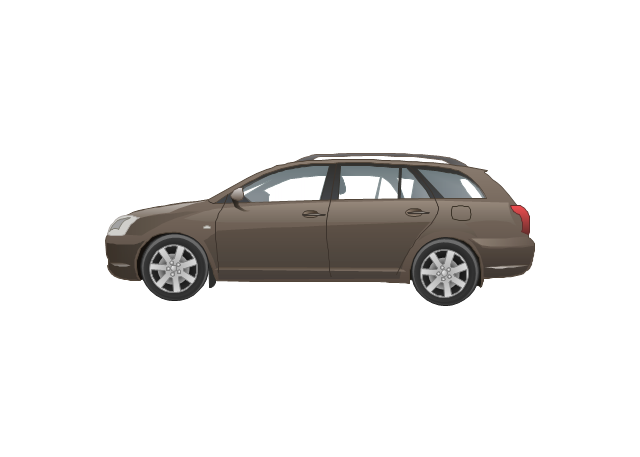
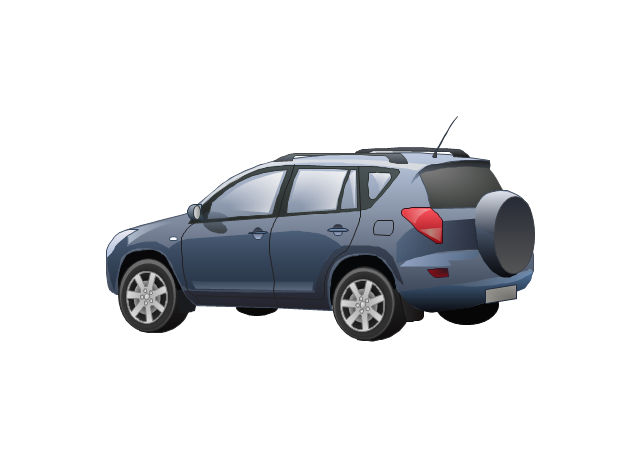
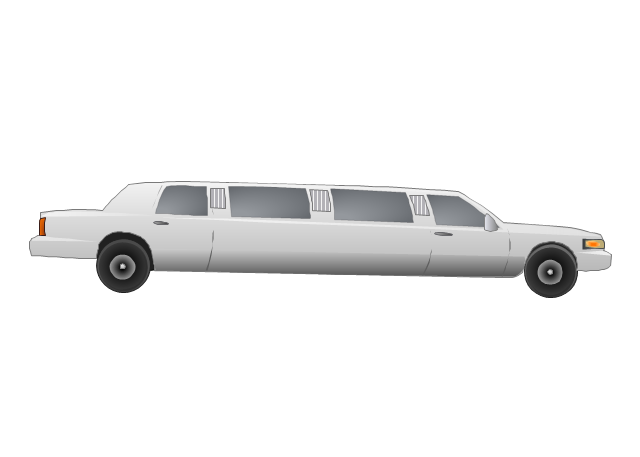
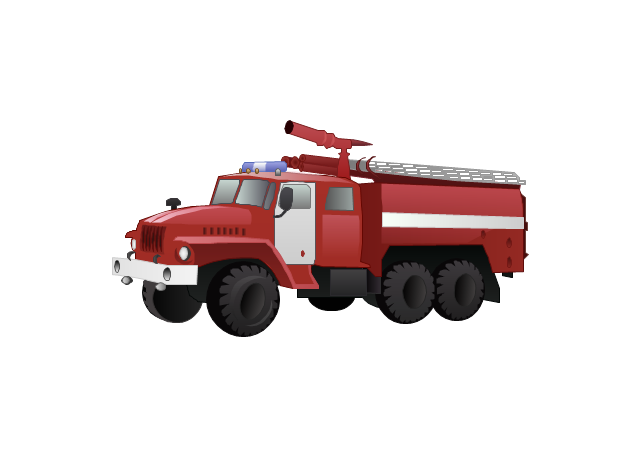
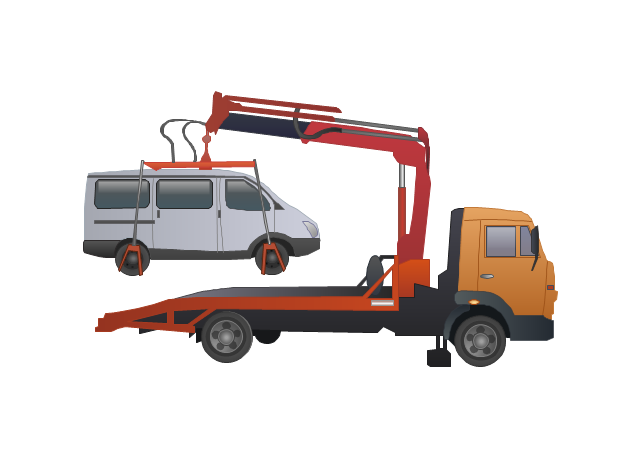
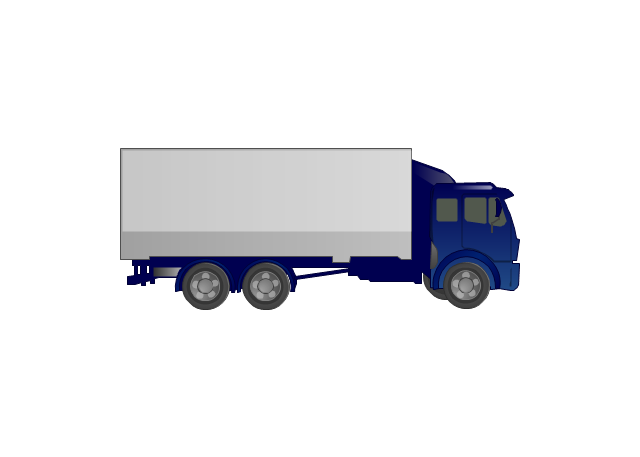
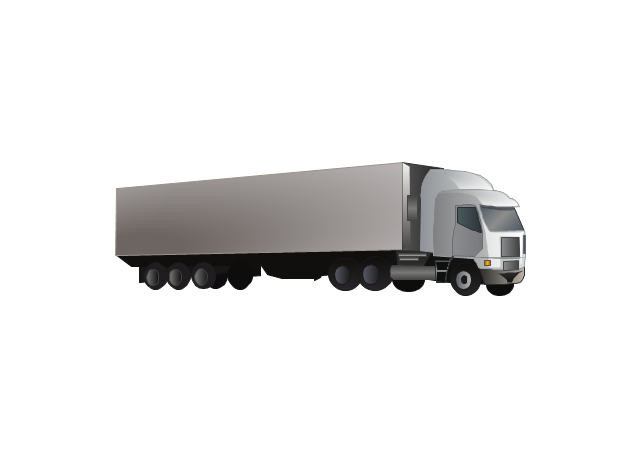
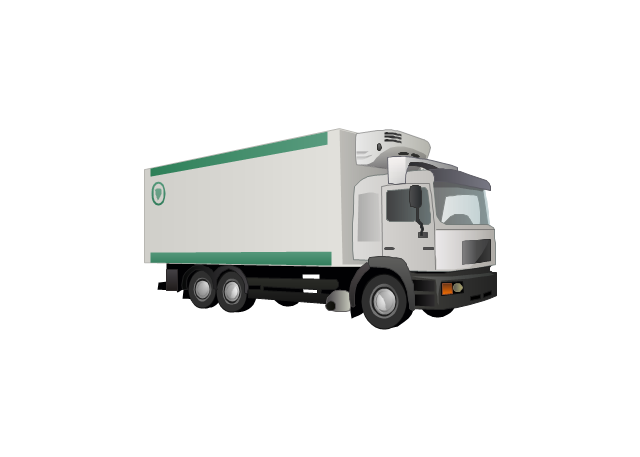
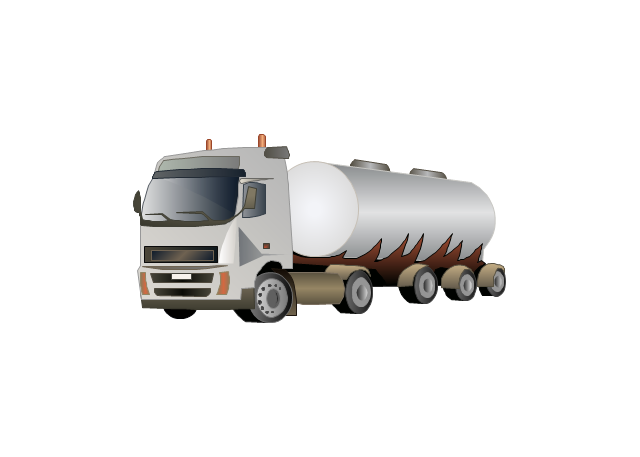
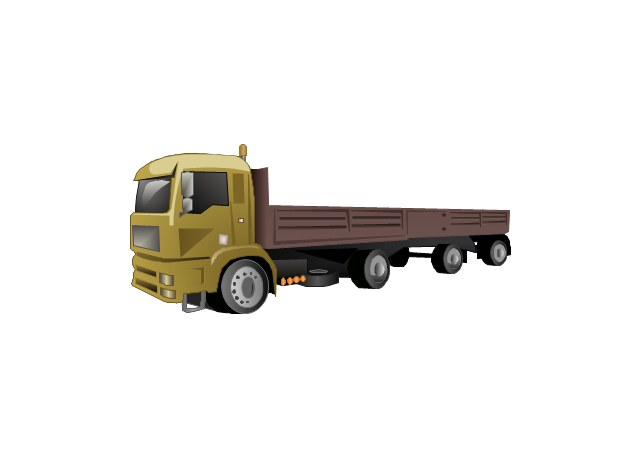
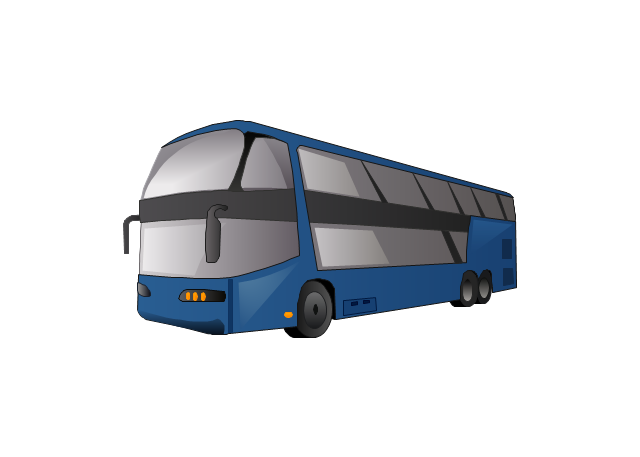
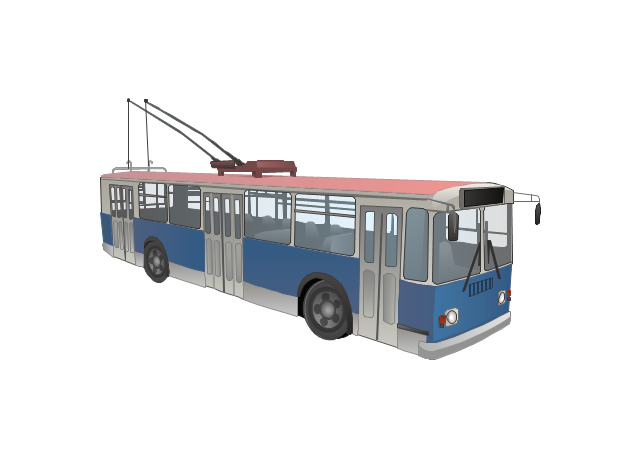
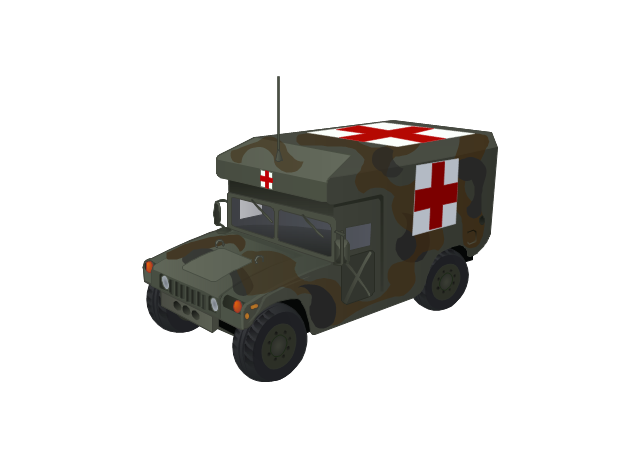
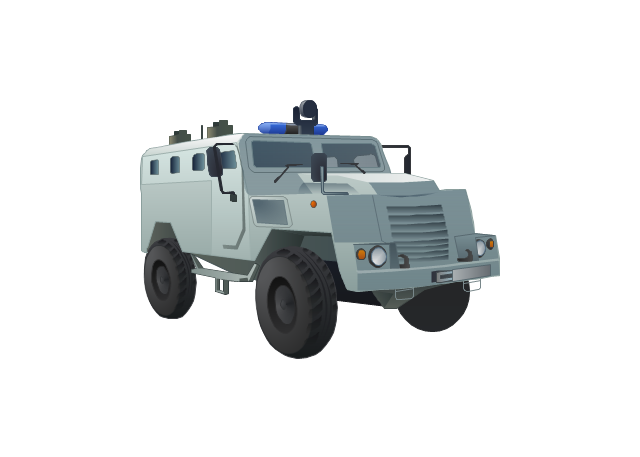
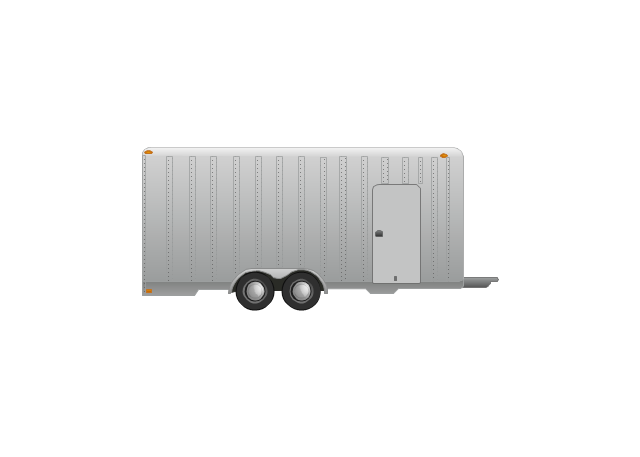
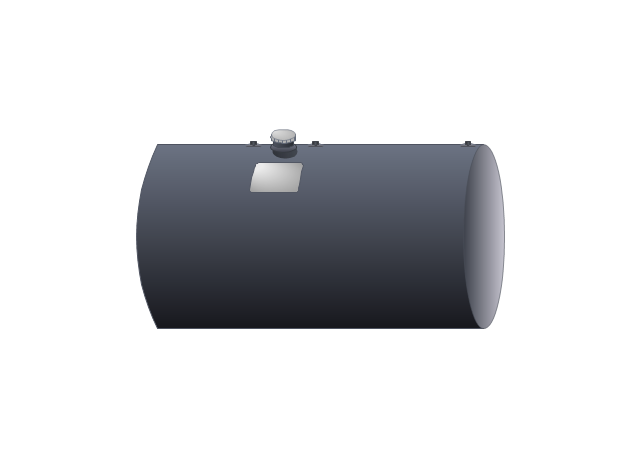
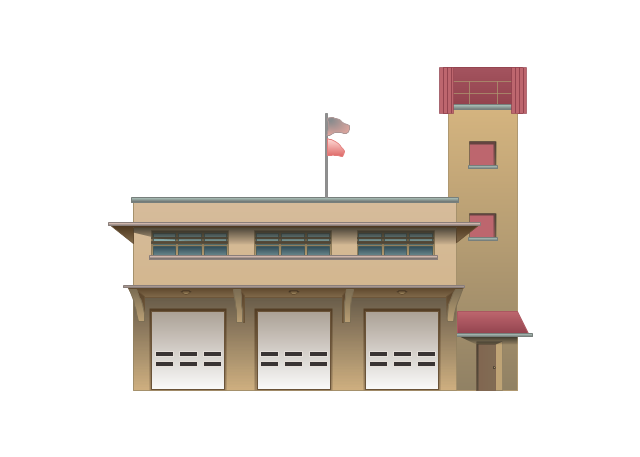
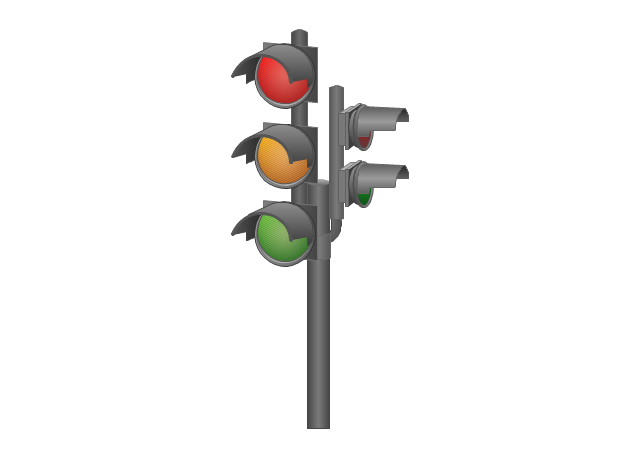
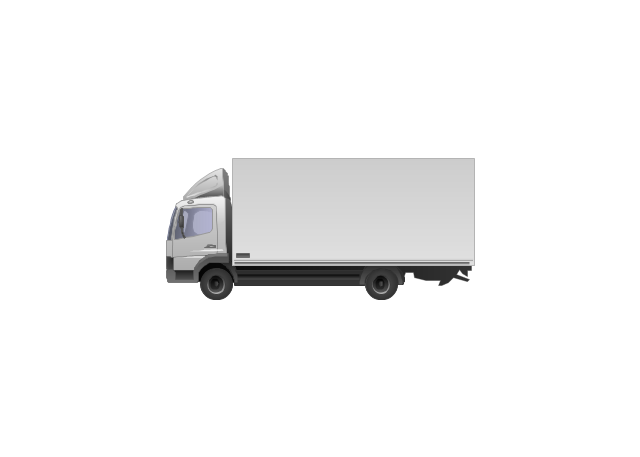
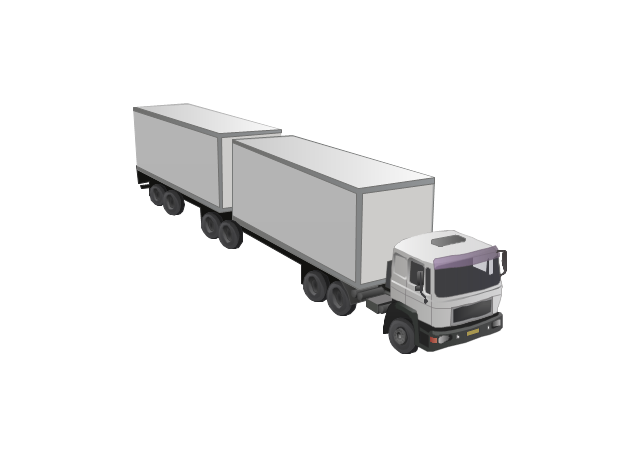
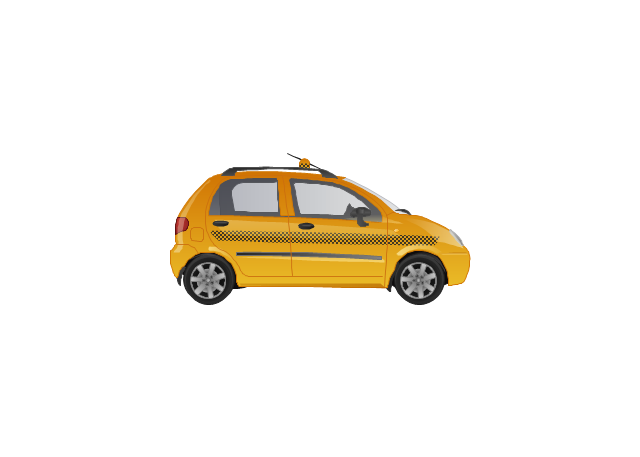
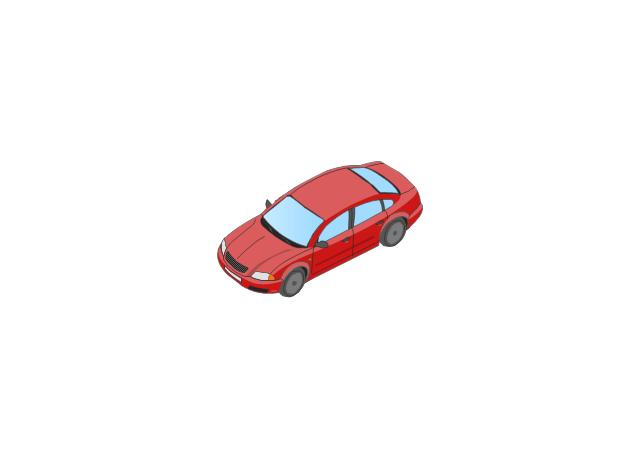
The vector stencils library "Road transport" contains 43 clip art images for creating vehicles and transportation illustrations, presentation slides, infographics and webpages using the ConceptDraw PRO diagramming and vector drawing software.
"Road transport (British English) or road transportation (American English) is the transport of passengers or goods on roads. ...
Transportation.
Transport on roads can be roughly grouped into the transportation of goods and transportation of people. In many countries licencing requirements and safety regulations ensure a separation of the two industries.
The nature of road transportation of goods depends, apart from the degree of development of the local infrastructure, on the distance the goods are transported by road, the weight and volume of the individual shipment, and the type of goods transported. For short distances and light, small shipments a van or pickup truck may be used. For large shipments even if less than a full truckload a truck is more appropriate. In some countries cargo is transported by road in horse-drawn carriages, donkey carts or other non-motorized mode. Delivery services are sometimes considered a separate category from cargo transport. In many places fast food is transported on roads by various types of vehicles. For inner city delivery of small packages and documents bike couriers are quite common.
People are transported on roads either in individual cars or automobiles, or in mass transit by bus or coach. Special modes of individual transport by road like rickshaws or velotaxis may also be locally available." [Road transport. Wikipedia]
The vector stencils library "Road transport" is included in the Aerospace and Transport solution from the Illustrations area of ConceptDraw Solution Park.
www.conceptdraw.com/ solution-park/ illustrations-aerospace-transport
Bicycle

Motorcycle
Race car
Car
Taxi

Sedan
Hatchback
Estate car
4x4
Limousine
Police car

Ambulance

Fire apparatus
Wrecker
Semi truck

Truck
Trailer
Refrigeration Truck
Petrol Tanker
Truck
Minibus

City Bus
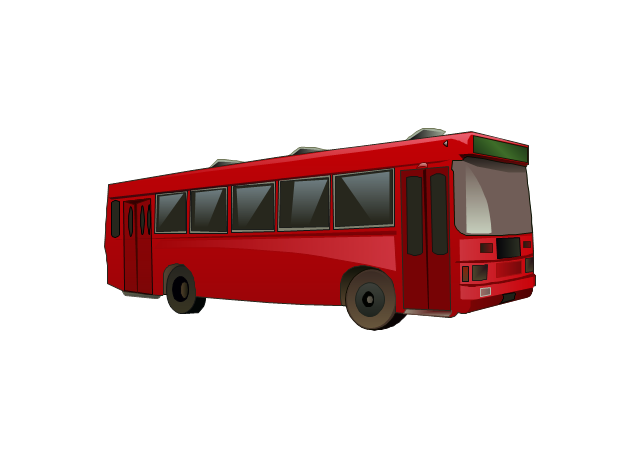
Bus

Sightseeing Bus

Double-decker Bus
Trolleybus
Military Ambulance
Armored police vehicle
First Aid Tent

Catering Vehicle

Semi-trailer
Fuel Tank
Fire Station
Signal Light
Walkie-Talkie

Lorry
B-Train
Taxi
Armored cash transport car

Car isometric
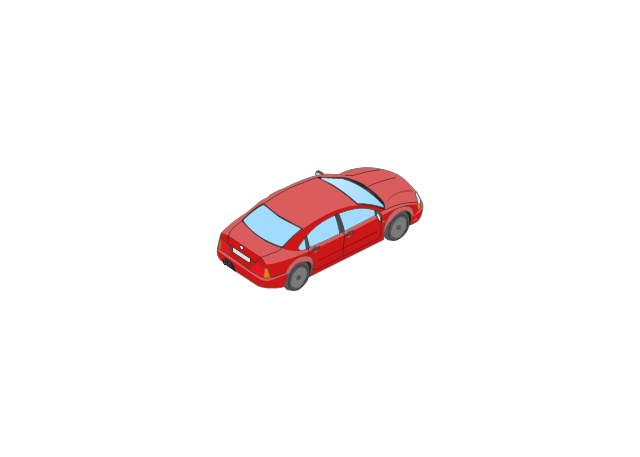
Car isometric
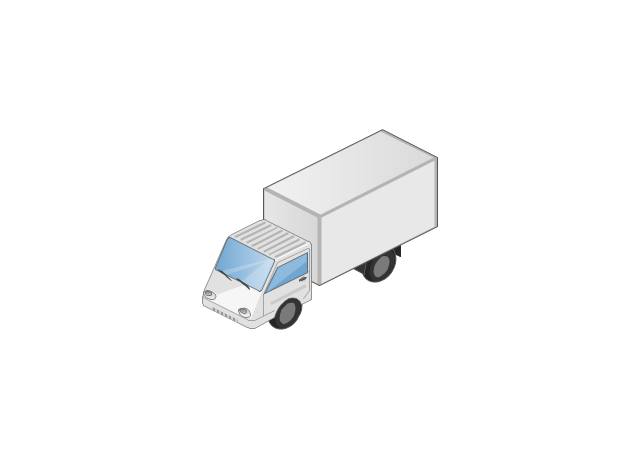
Box truck isometric
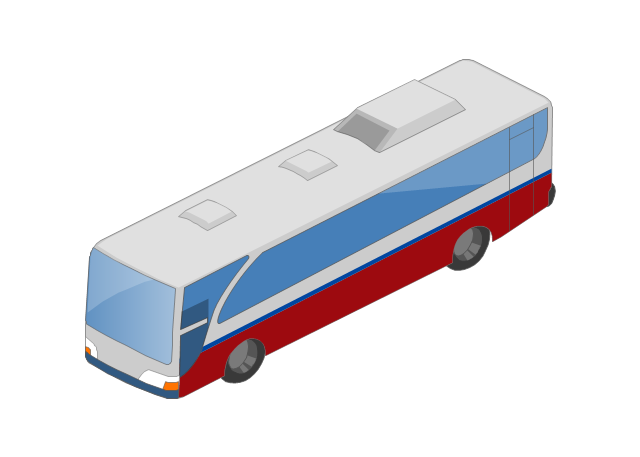
Bus isometric
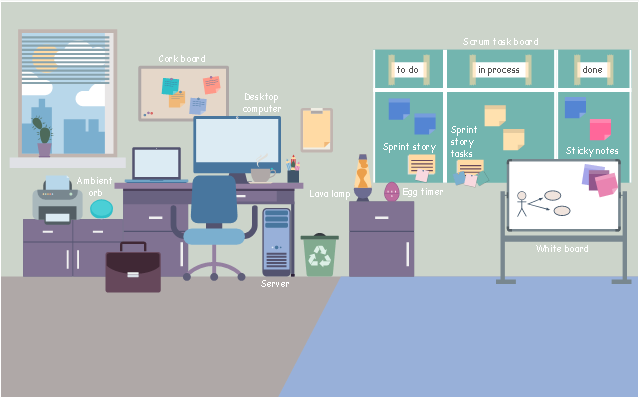
This agile software development infographic example was inspired by Mike Cohn's post "The Ideal Agile Workspace" from the Mountain Goat Software blog.
"... a list of all the things that ... should be visible within the ideal agile workspace:
* Big Visible Charts. ... the sprint burndown chart, showing the number of hours remaining as of each day of the current sprint. ... big visible charts showing the number of passing customer acceptance tests, the pass/ fail status of tests by day, sprint and release burndown charts, number of new stories introduced to the product backlog per sprint ...
* Additional feedback devices. ... a lava lamp that is turned on whenever the automated build is broken. ... flashing red traffic lights to indicate exceptional conditions such as an issue on a production server. ... ambient orbs and Nabaztag rabbits, which are wireless programmable devices that can also be configured to change colors, speak messages, or wiggle their ears as a team desires.
* Everyone on your team. Each person on the team should ideally be able to see each other person on the team. ...
* The sprint backlog. ... The best way to do that is by displaying the sprint backlog on a wall, ideally in the form of a task board A task board is usually oriented in rows and columns with each row containing a particular user story and one index card or sticky note for each task involved in that story. Task cards are organized in columns, minimally including “To Do” “In Process,” and “Done.” ...
* The product backlog. ... tack the index cards with those upcoming user stories on a wall where all can see them. ...
* At least one big white board. ...
* Someplace quiet and private. ...
* Food and drink. ...
* A window." [mountaingoatsoftware.com/ blog/ the-ideal-agile-workspace].
The infographic sample "Scrum workspace" was created using the ConceptDraw PRO software extended with the Scrum solution from the Project Management area of ConceptDraw Solution Park.
Infographic
IDEF0 standard with ConceptDraw DIAGRAM

- Hiring process workflow | Hiring Process | Recruitment | Employment ...
- Accounting Flowcharts | Financial Accounting Flowchart
- Computer Network Diagrams | Network Diagram Software Logical ...
- Total Quality Management Definition | Process Flowchart | Block ...
- Purchase order processing UML activity diagram | Order processing ...
- Purchase order processing UML activity diagram | UML class ...
- Road transport - Vector stencils library
- Purchase order processing UML activity diagram | UML interaction ...
- Purchase order processing UML activity diagram | Organizational ...
- Event-driven Process Chain Diagrams | Purchase order processing ...