3 Circle Venn. Venn Diagram Example

Circles Venn Diagram

Basic Circles Venn Diagram. Venn Diagram Example

Venn Diagram Template
Venn Diagram Examples for Problem Solving. Venn Diagram as a Truth Table

Venn Diagram Template for Word

Target Diagram

 Venn Diagrams
Venn Diagrams are actively used to illustrate simple set relationships in set theory and probability theory, logic and statistics, mathematics and computer science, linguistics, sociology, and marketing. Venn Diagrams are also often used to visually summarize the status and future viability of a project.
Multi Layer Venn Diagram. Venn Diagram Example

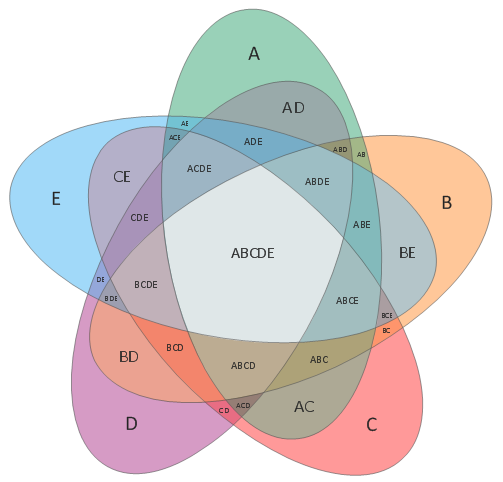
Use this template to design your four set Venn diagrams.
In maths logic Venn diagram is "a diagram in which mathematical sets or terms of a categorial statement are represented by overlapping circles within a boundary representing the universal set, so that all possible combinations of the relevant properties are represented by the various distinct areas in the diagram". [thefreedictionary.com/ Venn+diagram]
The template "4-set Venn diagram" for the ConceptDraw PRO diagramming and vector drawing software is included in the Venn Diagrams solution from the area "What is a Diagram" of ConceptDraw Solution Park.
Template

 Circle-Spoke Diagrams
Examples of subject areas that are well suited to this approach are marketing, business, products promotion, process modeling, market, resource, time, and cost analysis. Circle-Spoke Diagrams are successfully used in presentations, conferences, management documents, magazines, reportages, reviews, reports, TV, and social media.
The vector stencils library "Circular diagrams" contains 42 templates of circular diagrams: circular arrow diagram, circular motion diagram, arrow ring chart, doughnut chart (donut chart), circle pie chart, diamond pie chart, circle diagram, pie chart, ring chart, loop diagram, block loop diagram, arrow loop circle, crystal diagram, triangular diagram, diamond diagram, pentagon diagram, hexagon diagram, heptagon diagram, cycle diagram (cycle chart), stacked Venn diagram (onion diagram), arrow circle diagram.
Use these shapes to illustrate your marketing and sales documents, presentations, webpages and infographics in the ConceptDraw PRO diagramming and vector drawing software extended with the Target and Circular Diagrams solution from the Marketing area of ConceptDraw Solution Park.
www.conceptdraw.com/ solution-park/ marketing-target-and-circular-diagrams
Circular arrow diagram 1
Circular arrow diagram 2
Arrow ring chart
Doughnut chart

Diamond pie chart

Pie chart

Circle diagram

Circle pie chart 2

Circle pie chart 1

Ring chart 1 - 3 elements

Ring chart 1 - 4 elements

Ring chart 1 - 5 elements

Ring chart 1 - 6 elements

Ring chart 1 - 7 elements

Ring chart 2 - 3 elements

Ring chart 2 - 4 elements

Ring chart 2 - 5 elements

Ring chart 2 - 6 elements

Ring chart 2 - 7 elements

Crystal diagram - 3 elements

Crystal diagram - 4 elements

Crystal diagram - 5 elements

Crystal diagram - 6 elements

Crystal diagram - 7 elements

Stacked Venn diagram - 4

Stacked Venn diagram - 5

Stacked Venn diagram - 6

Stacked Venn diagram - 7

Basic loop diagram

Block loop diagram

Arrow loop circle
Arrow loop - 3 circles
Arrow loop - 4 circles
Arrow loop - 5 circles
Arrow loop - 6 circles
Arrow loop - 7 circles
Arrow circle diagram - 3
Arrow circle diagram - 4
Stacked Venn diagram - 3

Arrow circle diagram - 5
Arrow circle diagram - 6
Arrow circle diagram - 7
Cylinder Venn Diagram

 Fishbone Diagram
Fishbone Diagrams solution extends ConceptDraw DIAGRAM software with templates, samples and library of vector stencils for drawing the Ishikawa diagrams for cause and effect analysis.
SWOT Analysis Tool for Small Business

- 4 Circle Venn Diagram Template
- Venn Diagram Generator 4 Circles
- Venn Diagrams | Venn Diagram Template | Circles Venn Diagram ...
- Venn Diagram 4 Circles Generator
- 4 -Set Venn diagram - Template | 3 Circle Venn. Venn Diagram ...
- 4 -Set Venn diagram - Template | Venn Diagram Examples for ...
- Euler Diagram Generator 4 Circles
- Venn Diagrams | Venn Diagram Examples for Problem Solving ...
- 5 Circle Euler Diagram Maker
- 4 Circle Venn Diagram Maker
- 3 Circle Venn Diagram . Venn Diagram Example | Venn Diagram ...
- 3 Circle Venn Diagram Maker
- Venn Diagram Template | 3 Circle Venn Diagram . Venn Diagram ...
- 3 Circle Venn Diagram . Venn Diagram Example | Venn Diagram ...
- 6 Way Venn Diagram Generator
- Venn Diagram 4 Circles Problems
- 5 Set Venn Diagram Generator
- Circles Venn Diagram
- Math Venn Diagram Generator
- 3 Circle Venn Diagram . Venn Diagram Example | 2-Set Venn ...