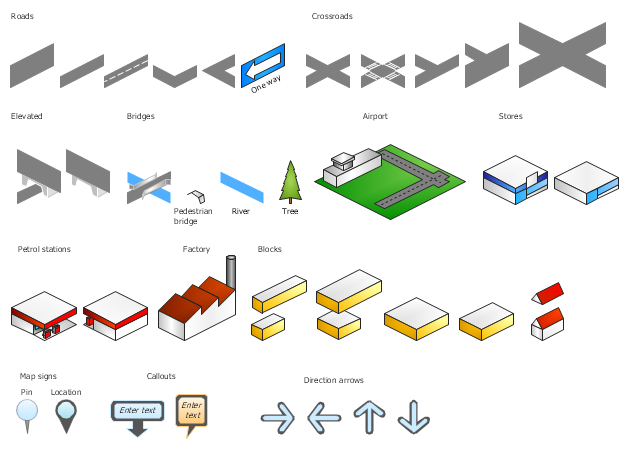
The vector stencils library "3D directional maps" contains 40 symbols for creating pictorial maps, street maps, locator maps, transit maps, tourist maps with points of interest (POI), road maps and route maps using the ConceptDraw PRO diagramming and vector drawing software.
"Pictorial maps are a category of maps that are also loosely called illustrated maps, panoramic maps, perspective maps, bird’s-eye view maps and Geopictorial maps amongst others. In contrast to the regular road map, Atlas or topographic cartography, pictorial maps depict a given territory with a more artistic rather than technical style. The cartography can be a sophisticated 3-D perspective landscape or a simple map graphic enlivened with illustrations of buildings, people and animals. They can feature all sorts of varied topics like historical events, legendary figures or local agricultural products and cover anything from an entire continent to a college campus. ...
Pictorial maps usually show an area as if viewed from above at an oblique angle. They are not generally drawn to scale in order to show street patterns, individual buildings, and major landscape features in perspective. While regular maps focus on the accurate rendition of distances, pictorial maps enhance landmarks and often incorporate a complex interplay of different scales into one image in order to give the viewer a more familiar sense of recognition." [Pictorial maps. Wikipedia]
The design elements library "3D directional maps" is included in the Directional Maps solution from the Maps area of ConceptDraw Solution Park.
3D pictorial map symbols
In searching of alternative to MS Visio for MAC and PC with ConceptDraw DIAGRAM

Design Element: Rack Diagram for Network Diagrams
.png)

 Block Diagrams
Block diagrams solution extends ConceptDraw DIAGRAM software with templates, samples and libraries of vector stencils for drawing the block diagrams.
 Directional Maps
Directional Maps solution extends ConceptDraw DIAGRAM software with templates, samples and libraries of vector stencils for drawing the directional, location, site, transit, road and route maps, plans and schemes.
 Basic Diagramming
This solution extends ConceptDraw DIAGRAM software with the specific tools you need to easily draw flowcharts, block diagrams, histograms, pie charts, divided bar diagrams, line graphs, circular arrows diagrams, Venn diagrams, bubble diagrams and concept maps
 Maps
Maps
This solution extends ConceptDraw DIAGRAM.4 with the specific tools necessary to help you draw continental, directional, road, or transit maps, to represent international, business, or professional information visually.
HelpDesk
How to Draw a Histogram

HelpDesk
How to Create a Bar Chart

- Free 3d Landscape Design Software
- 3D Network Diagram Software
- How To use House Electrical Plan Software | Electrical Diagram ...
- 3D Network Diagram Software
- How To use House Electrical Plan Software | 3D Network Diagram ...
- 3d Map Drawing Software
- Telecommunication Network Diagrams | Network Drawing Software ...
- 3D Network Diagram Software | Fully Connected Network Topology ...
- 3D Network Diagram Software | How to Draw a Computer Network ...
- 3D Block diagram - Template
- Design elements - 3D directional maps | Maps and Directions | Sign ...
- 3d Wiring Diagram Software
- 3D Network Diagram Software
- Telecommunication Network Diagrams | 3D Network Diagram ...
- Bar Chart Software | Pyramid Diagram and Pyramid Chart | Pyramid ...
- Computer and Networks Area | Network Diagram Software (PRO ...
- Best Software to Draw Diagrams | Workflow Diagram Examples ...
- Network Diagramming Software for Design Cisco Network Diagrams ...
- Design elements - Sunrooms | Design elements - 3D directional ...
- 3d Network Chart Software