The Value Stream Mapping Process
This graphical representation of a process is a powerful tool that helps in the diagnosis of process efficiency and allows companies to develop improved processes. Many lean practitioners use Value Stream Mapping as a fundamental tool to identify waste, cut process cycle times, and implement process improvement. Other organizations use value stream mapping as a key portion of their lean efforts.
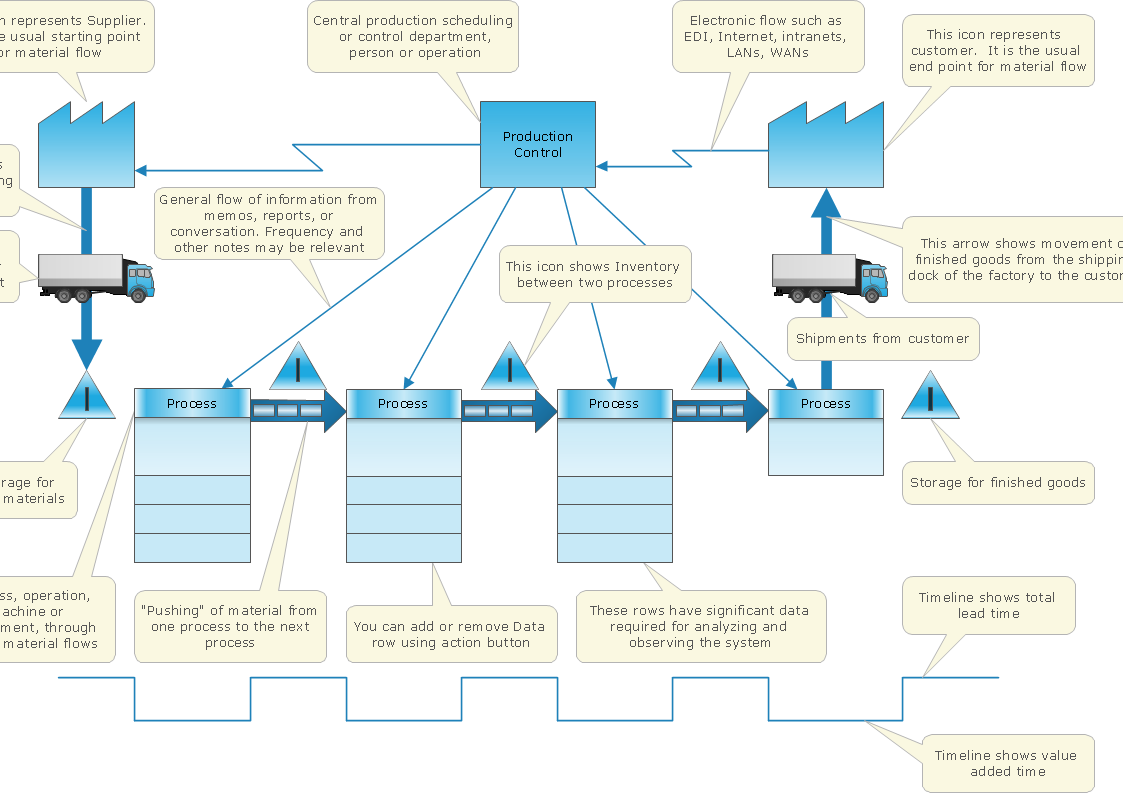
Pic.1 VSM diagram template.
Value Stream Maps are used in lean manufacturing methodology to analyze and identify the process improvement opportunities that are available.
See also Samples:
THREE RELATED HOW TO's:
The innovative ConceptDraw Arrows10 Technology included in ConceptDraw DIAGRAM is a powerful drawing tool that changes the way diagrams are produced.
While making the drawing process easier and faster.
This is more than enough versatility to draw any type of diagram with any degree of complexity.
Picture: How to Dramatically Reduce Drawing Time - New connection modes
When you need a drawing software to create a professional looking cross-functional charts, ConceptDraw with its Arrows10 Technology - is more than enough versatility to draw any type of diagram with any degree of complexity.
Use templates with process maps, diagrams, charts to get the drawing in minutes.
Picture: Cross-Functional Process Map Template
Value Stream Mapping solution extends ConceptDraw DIAGRAM software with tools for drawing Value Stream Maps (VSM): templates, samples and library of vector stencils.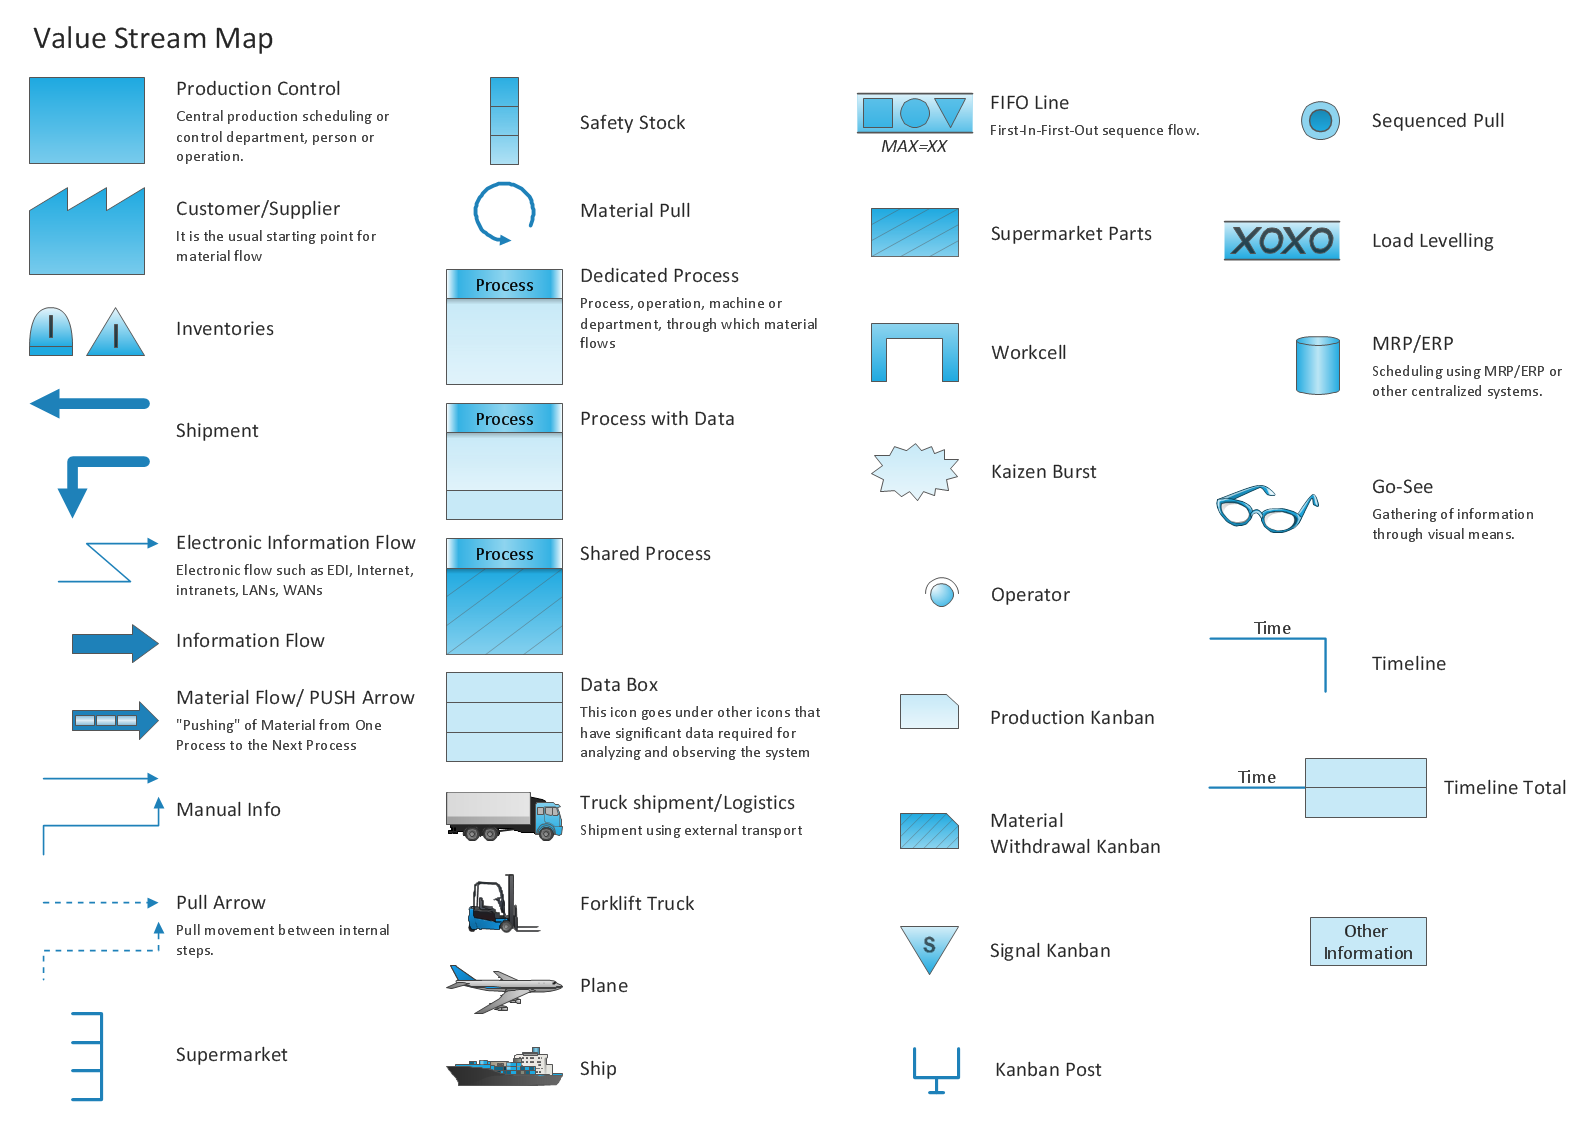
Picture: Value Stream Mapping Tool
Related Solution:
ConceptDraw
MINDMAP 16