HR Charts
HR Charts include HR organizational charts, HR process management flowcharts, HR fishbone or problem-solving diagrams, HR matrix diagrams, HR dashboards, HR development charts, HR recruitment charts for different aspects of company development, and other types of diagrams.
HR process management flowcharts visualize processes and functions to increase the company's efficiency.
HR recruitment diagram can help in the recruitment process which is one of the fundamental HR processes. Because the development and expansion of the company are directly connected to hiring skilled employees and appointing them to the correct positions.
HR development diagrams provide a plan of development for the company's team after the recruitment of talented employees. It supposes training and upskilling the employees.
HR fishbone Diagrams or HR problem-solving diagrams are used to identify causes and cause-effect relationships when some problems happen in the company, either between employees or within a process. It provides effective analysis of information and speeds up problem-solving.
HR organizational Charts are the most common, especially for large organizations with several different hierarchical layers, many employees, and a variety of roles. HR Organizational Chart is a visual representation of the internal organizational structure of the company's HR department, which performs one of the most essential functions of any business. All roles and responsibilities within the HR department are clearly defined. The employees of the HR department are responsible for recruitment, training, benefits, and more issues related to human resources in an organization.
HR organizational chart shows the hierarchy of the employees, outlines their primary roles and responsibilities, and relationships between the individuals of the same and different HR department levels (employees, managers, supervisors, etc.). It shows who does what and who reports to whom in the hierarchy. As a rule, the individuals of the lower level report to ones from the higher level. Creating effective and functional HR diagrams is closely related to the human resource planning process and the individual needs of your business. Predominantly HR organizational charts are used by the HR department to visualize, plan, and manage human resources, functions, and processes of a company, optimize employees' productivity and process performance, and ensure that the business operates effectively. HR Matrix Diagram is another kind of HR org chart which differs by the layout of data and is used for complex hierarchies.
The representation of the HR department structure in the simple and visual format of HR chart easier its understanding by all stakeholders. Employees understand who is responsible for each key HR function, what are their roles in meeting a common objective, and who they are responsible to. This provides efficient feedback, speeds up employees' work and decision-making, and respectively leads to faster company growth.
Example 1. HR Charts Development in ConceptDraw DIAGRAM
The positions included in HR chart depend on the size of your company. The larger a company is, the more HR professionals are involved. However, some crucial roles should be included in the company and chart. One person can handle HR issues in a small business, while the HR department of a large enterprise may include many employees on different levels and as a rule, each HR employee may perform only one function and be solely responsible for it. High management (HR director or HR manager) is at the top of the chart and manages one or two HR team members, which in turn manage the HR employees of the lower level. Some HR functions may be also outsourced.
HR chart shows the pathway of HR processes and expected outcomes, and visualizes the flow of information throughout the company. Business leaders use it to observe a whole structure, how the company strategy is implemented and objectives are met. It helps to identify the ways to grow and develop, potential gaps in the functions performed by HR and open positions to be filled.
HR diagrams are vital for the success of a company of any size, for effective and correct implementation changes within the organization. They reflect business capabilities and opportunities, help to predict the effects of these changes, easier the implementation of the corporate strategy and objectives. HR diagrams are multi-purpose, they help clarify employees' hierarchy, roles, and responsibilities, improve interdepartmental team collaboration, maximize employees' skills and opportunities, and identify departments with the ability to grow. They help to optimize HR processes and operations, ensure better human resource management, increase productivity, and in time identify and eliminate problems and inefficiencies.

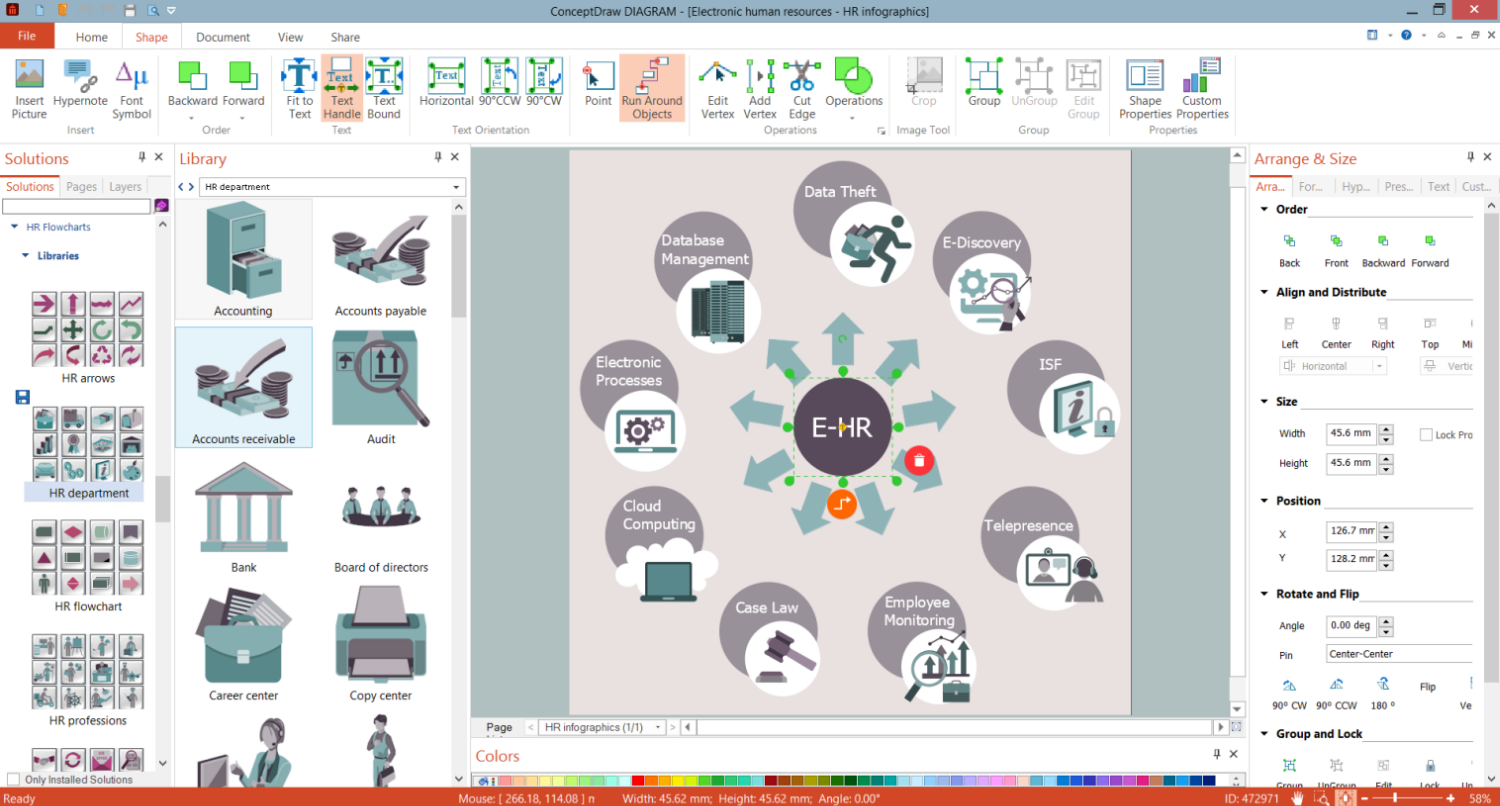
Example 2. HR Flowcharts Solution Libraries
To create an effective HR chart use the ConceptDraw DIAGRAM vector design software with HR Flowcharts solution and follow the simple steps:
- identify the company's purpose and set the key objectives on the way to achieve it;
- identify your HR processes and team structures, gather information on your employees, their roles and responsibilities;
- use powerful drawing tools and predesigned vector objects from the HR Flowcharts solution libraries to visualize the employees' structure or your processes from the top down (from leader or manager to lower levels in the hierarchy) and link the elements;
- use various shapes, icons, or colors to separate and highlight items;
- update your diagram regularly, at any changes in your company, and share it with the employees.
Manage employees, develop HR strategic plan, HR charts, HR organizational charts, show investment and construction application procedures, and realize corporate strategy effectively with ConceptDraw DIAGRAM software and HR Flowcharts solution.

Example 3. HR Flowchart - Competency Based Management
The HR Charts you see on this page were created in ConceptDraw DIAGRAM software using the extensive drawing tools of the HR Flowcharts Solution and visually show hiring process on the HR Flowchart. They successfully demonstrate the solution's capabilities and professional results you can achieve. An experienced user spent 10-15 minutes creating each of these samples.
Use the powerful tools of the HR Flowcharts Solution for ConceptDraw DIAGRAM software for effective hiring process and for quick and easy creating professional-looking HR Flowcharts. Use successfully the created diagrams in your work and personal activity.
All source documents are vector graphic documents. They are available for reviewing, modifying, or converting to a variety of formats (PDF file, MS PowerPoint, MS Visio, and many other graphic formats) from the ConceptDraw STORE. The HR Flowcharts Solution is available for all ConceptDraw DIAGRAM users.