Audio and Video Configurations
With ConceptDraw DIAGRAM diagram software users can create any audio and video device configurations. The Audio & Video Connectors solution includes sockets and plugs professional-looking stencils and several samples that you can modify and make your hookup diagram of the home media connections.

Sample 1. Hook-up drawing - Stereo audio visual entertainment systems.
This hookup diagram was created in ConceptDraw DIAGRAM diagramming software using the Audio and Video Connectors solution.
Illustrate your system connections using library with icons of jacks, plugs and device silhouettes from the Audio and Video Connectors solution.
SEVEN RELATED HOW TO's:
Creating CCTV system diagrams is quick and easy with ConceptDraw DIAGRAM diagramming software enhanced with Audio, Video, Media solution from ConceptDraw Solution Park. It contains library of vector cliparts of video and TV devices and different digital gadgets for drawing this kind of diagrams.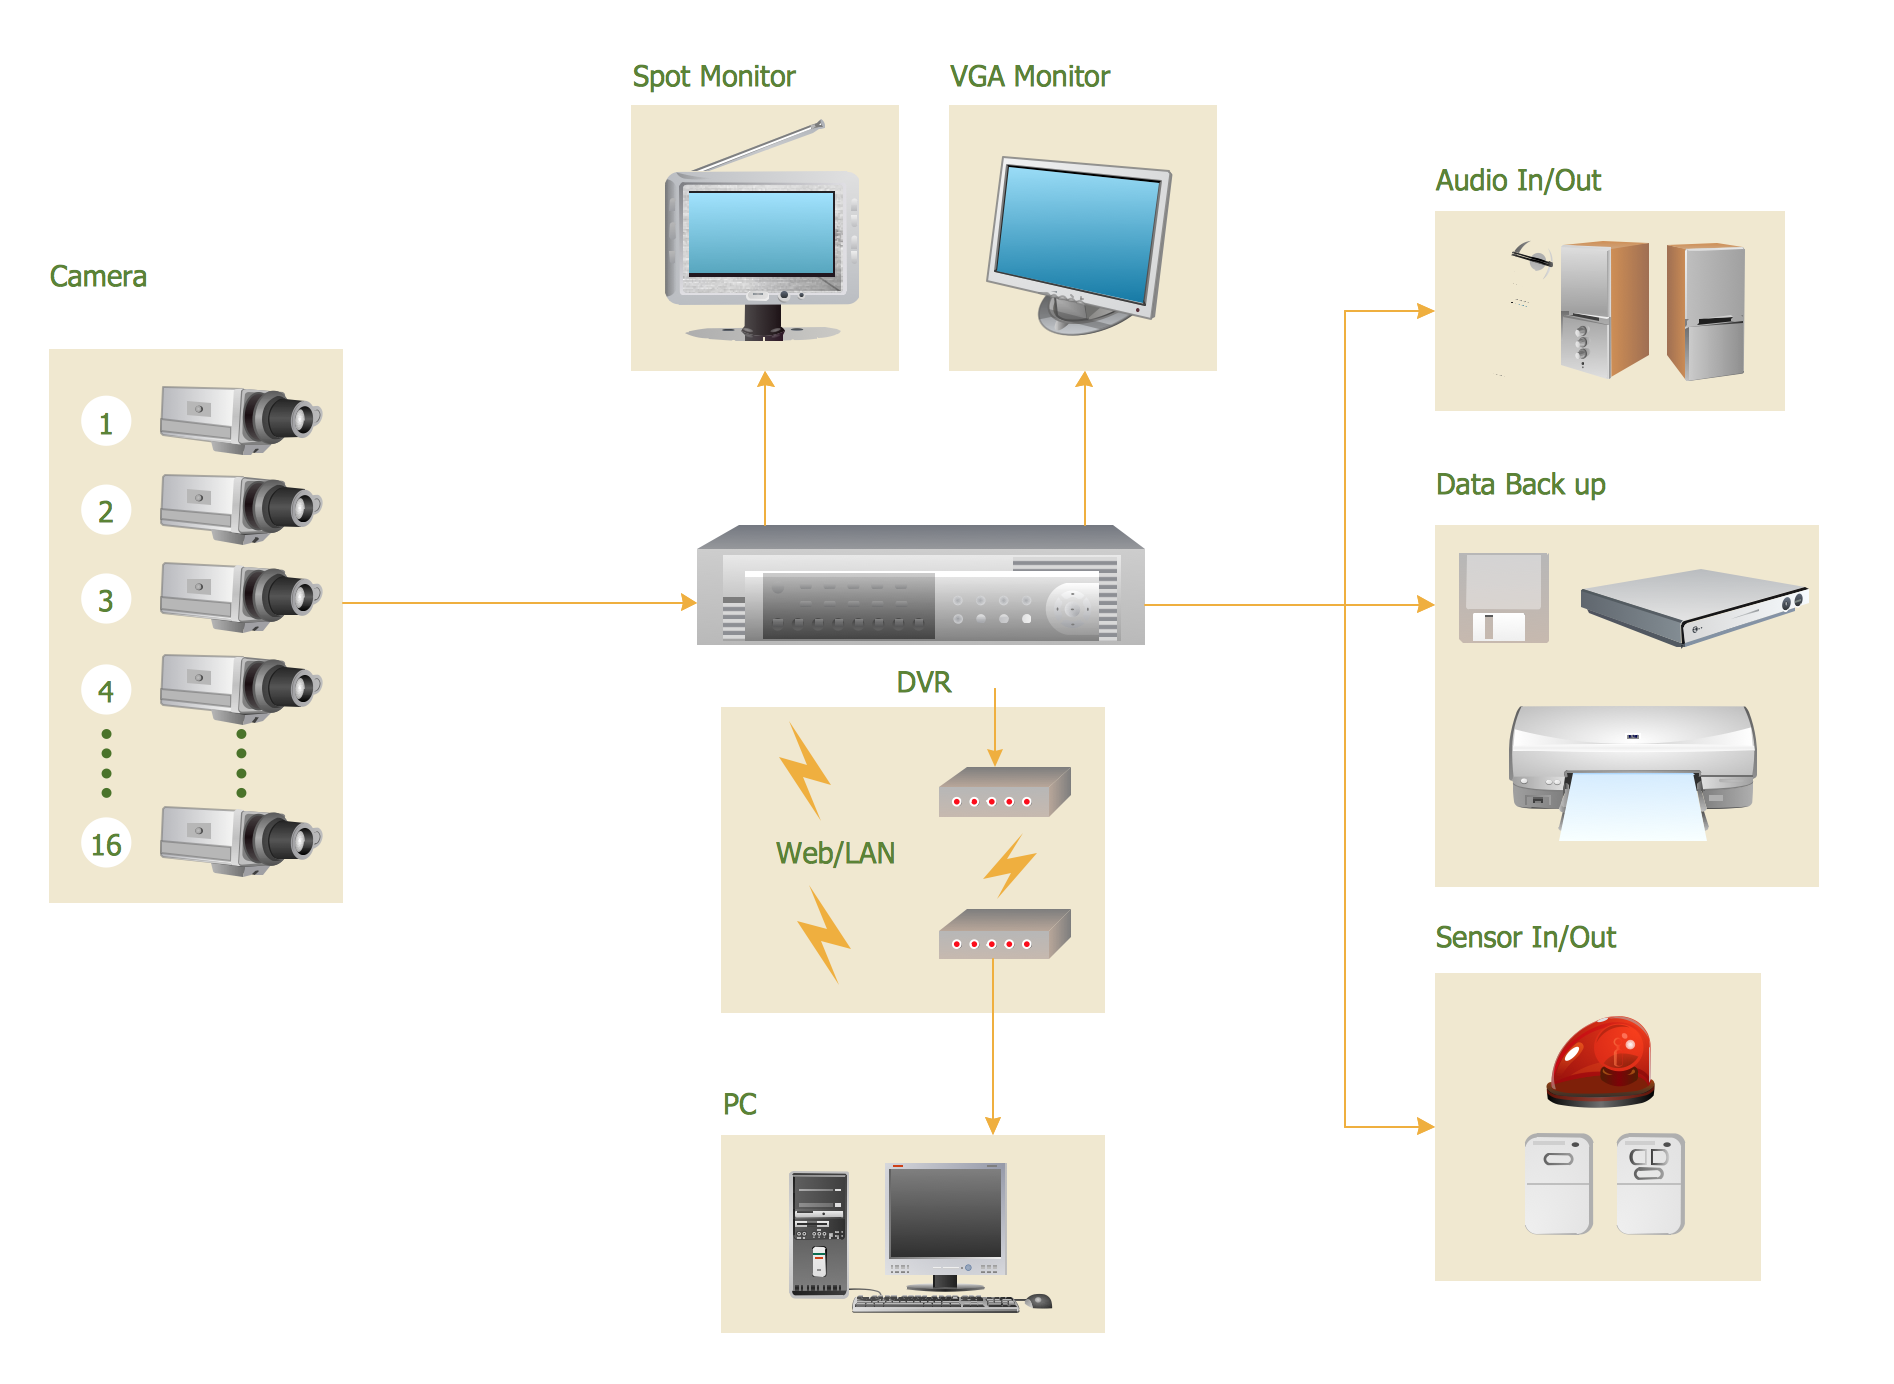
Picture: CCTV Surveillance System Diagram. CCTV Network Diagram Example
Related Solutions:
The Audio & Video Connectors solution contains a set of pre-designed objects, libraries, templates, and samples; allowing quick and easy diagramming of various configurations of audio and video devices.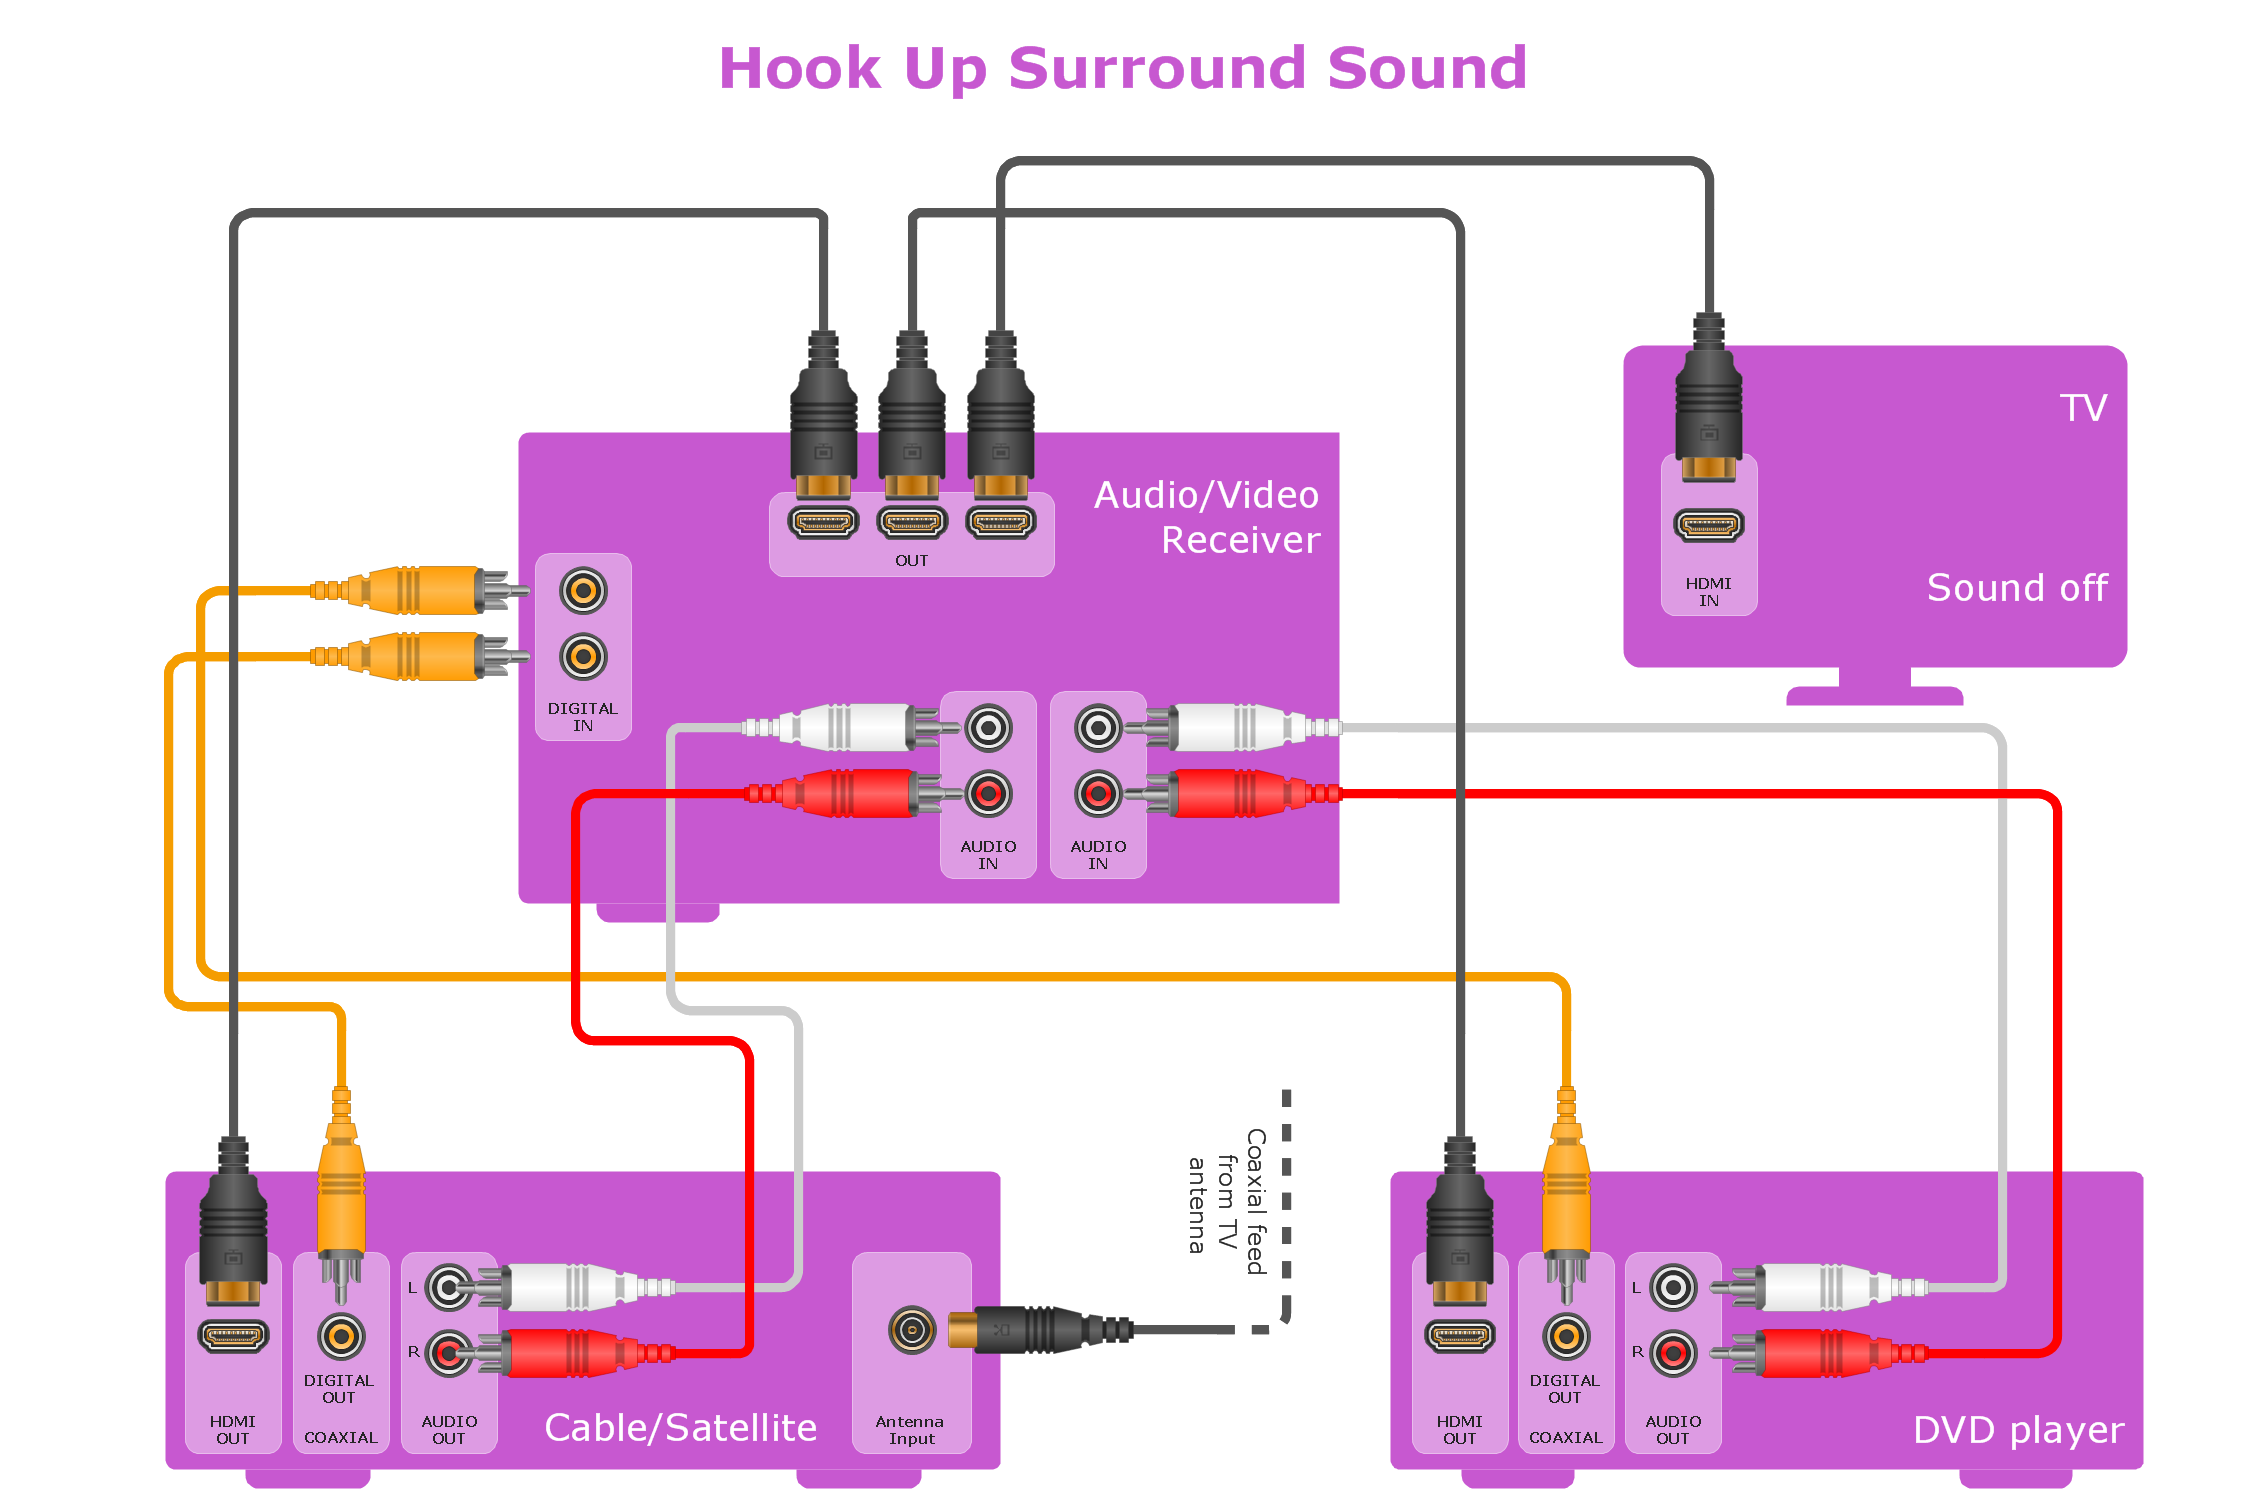
Picture: Making Your Audio and Video Connections
Related Solution:
The Audio & Video Connectors solution contains a set of pre-designed objects, libraries, templates, and samples; allowing quick and easy diagramming of various configurations of audio and video devices.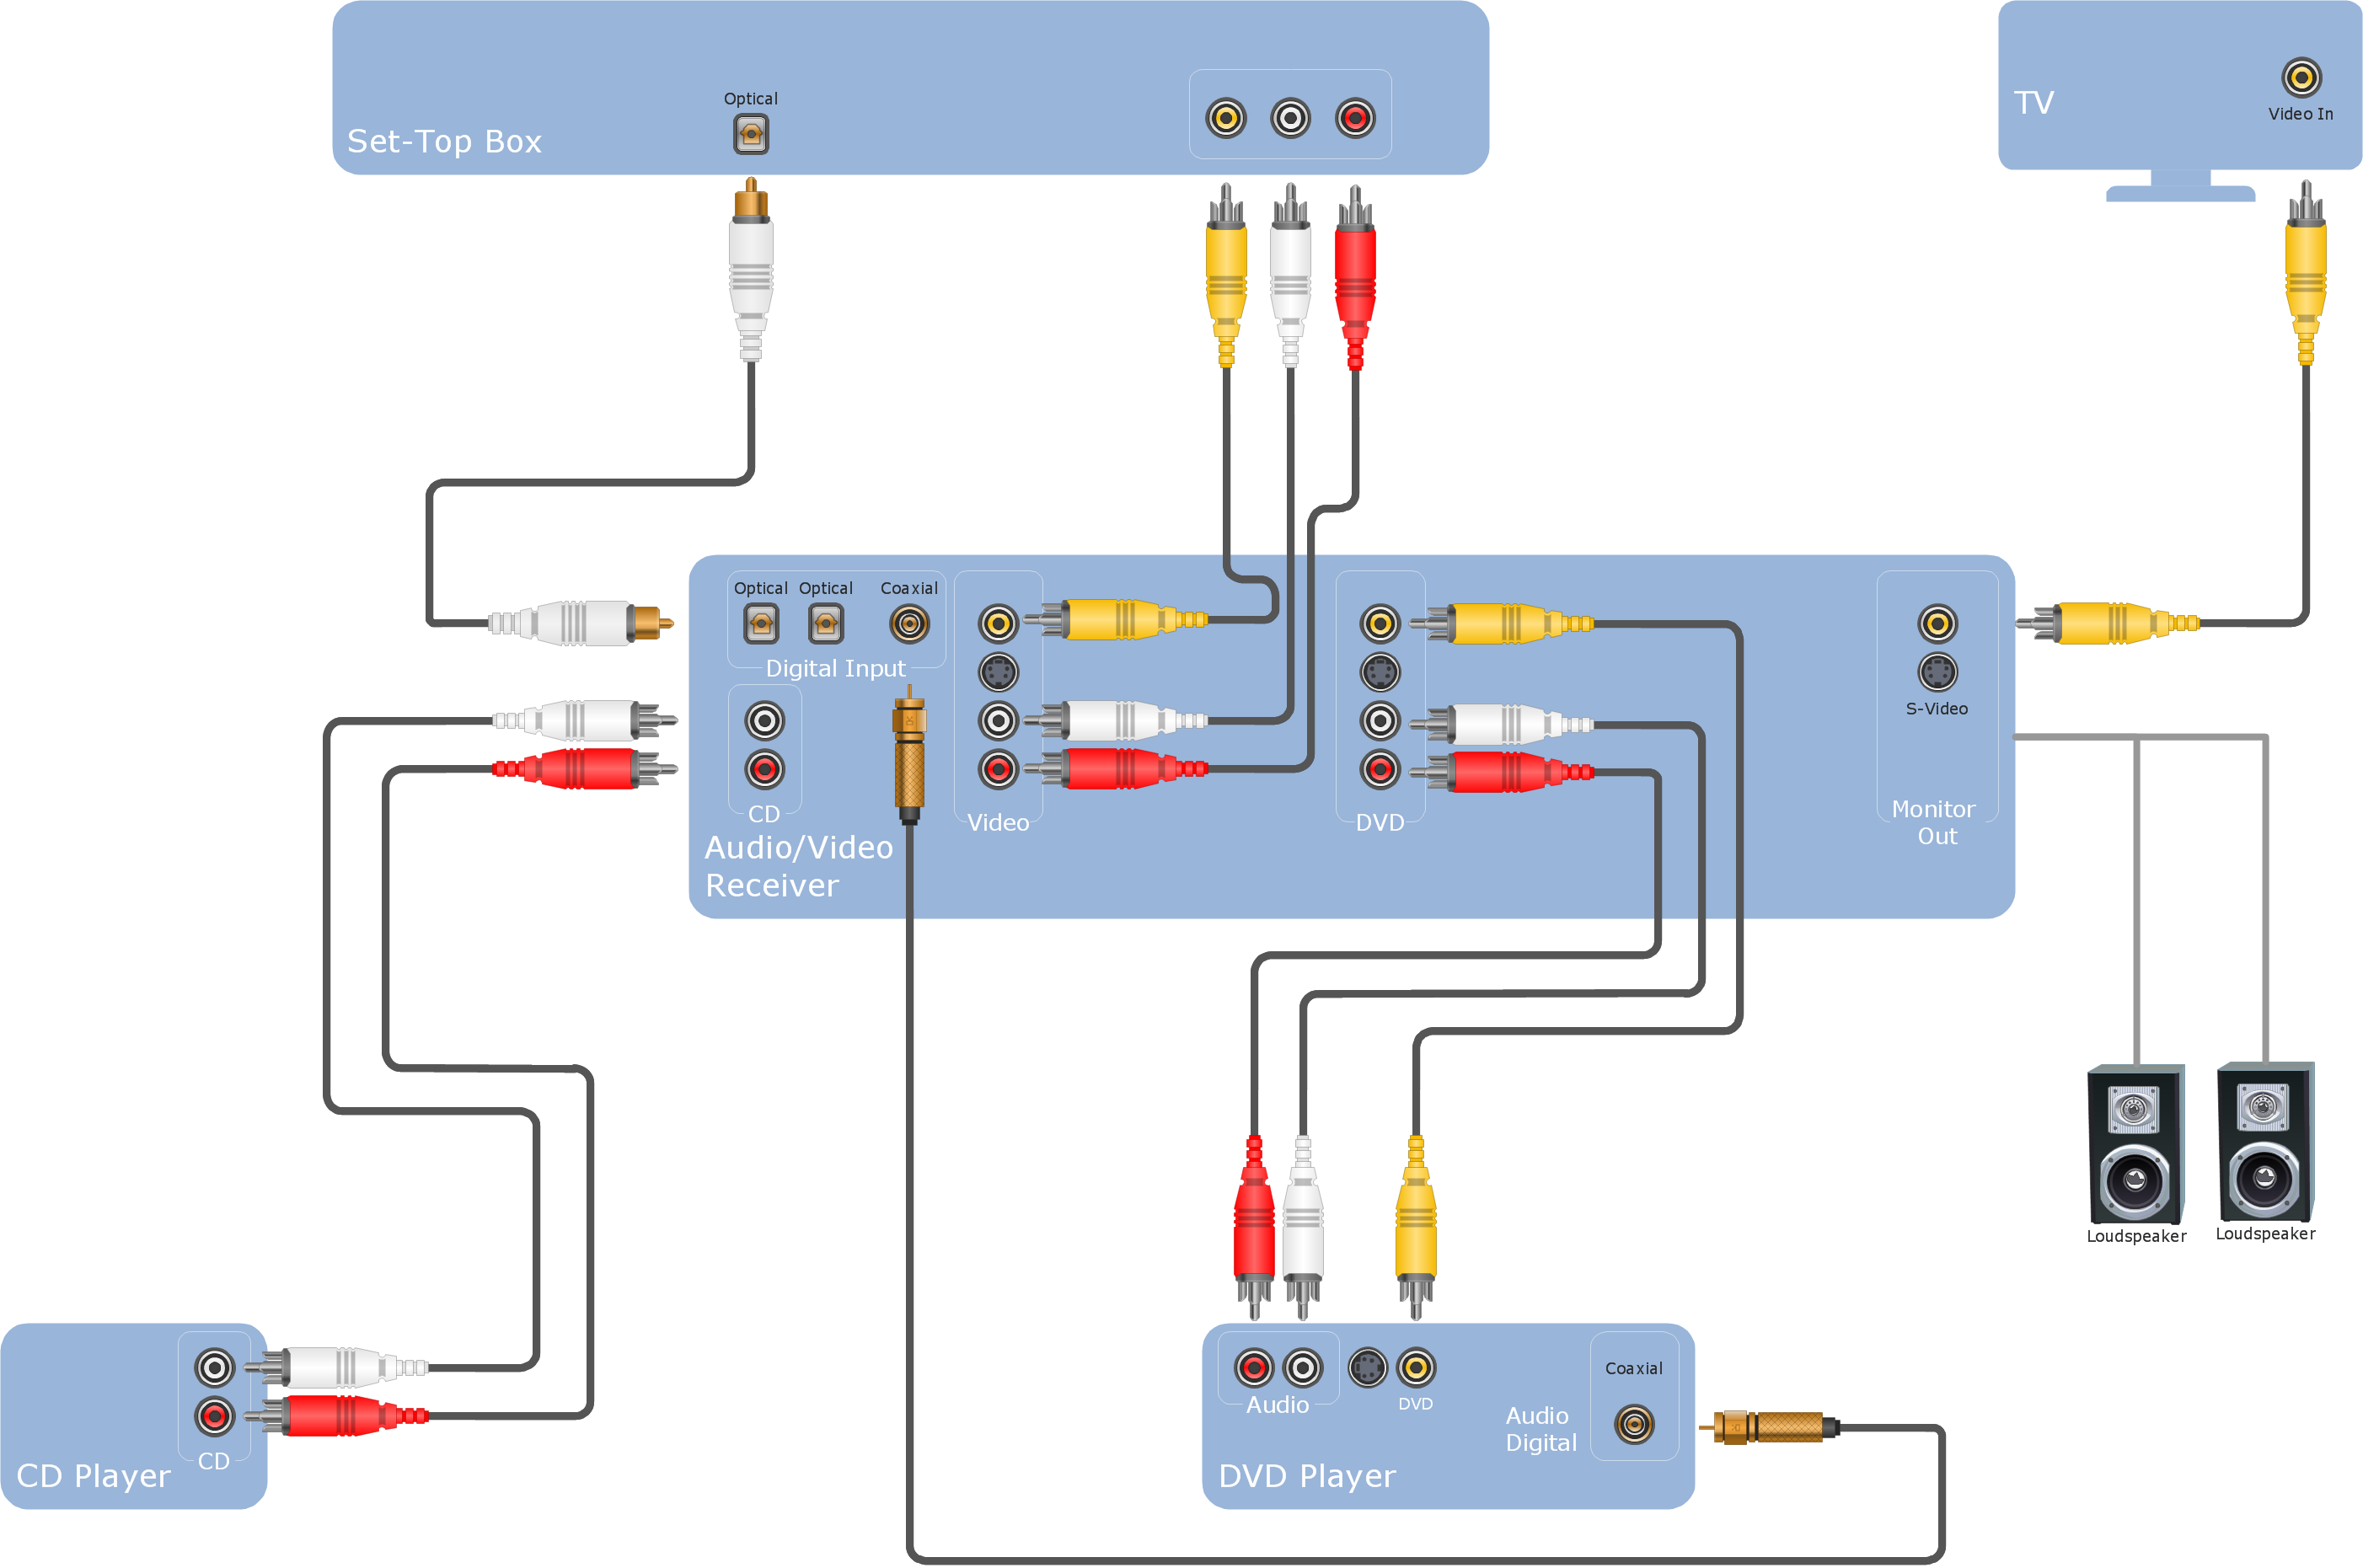
Picture: Audio Visual Cables and Connectors
Related Solution:
ConceptDraw DIAGRAM enhanced with Audio, Video, Media solution is a helpful tool for illustration of a CCTV network. It contains library of vector cliparts of video and TV devices and different digital gadgets for drawing such illustrations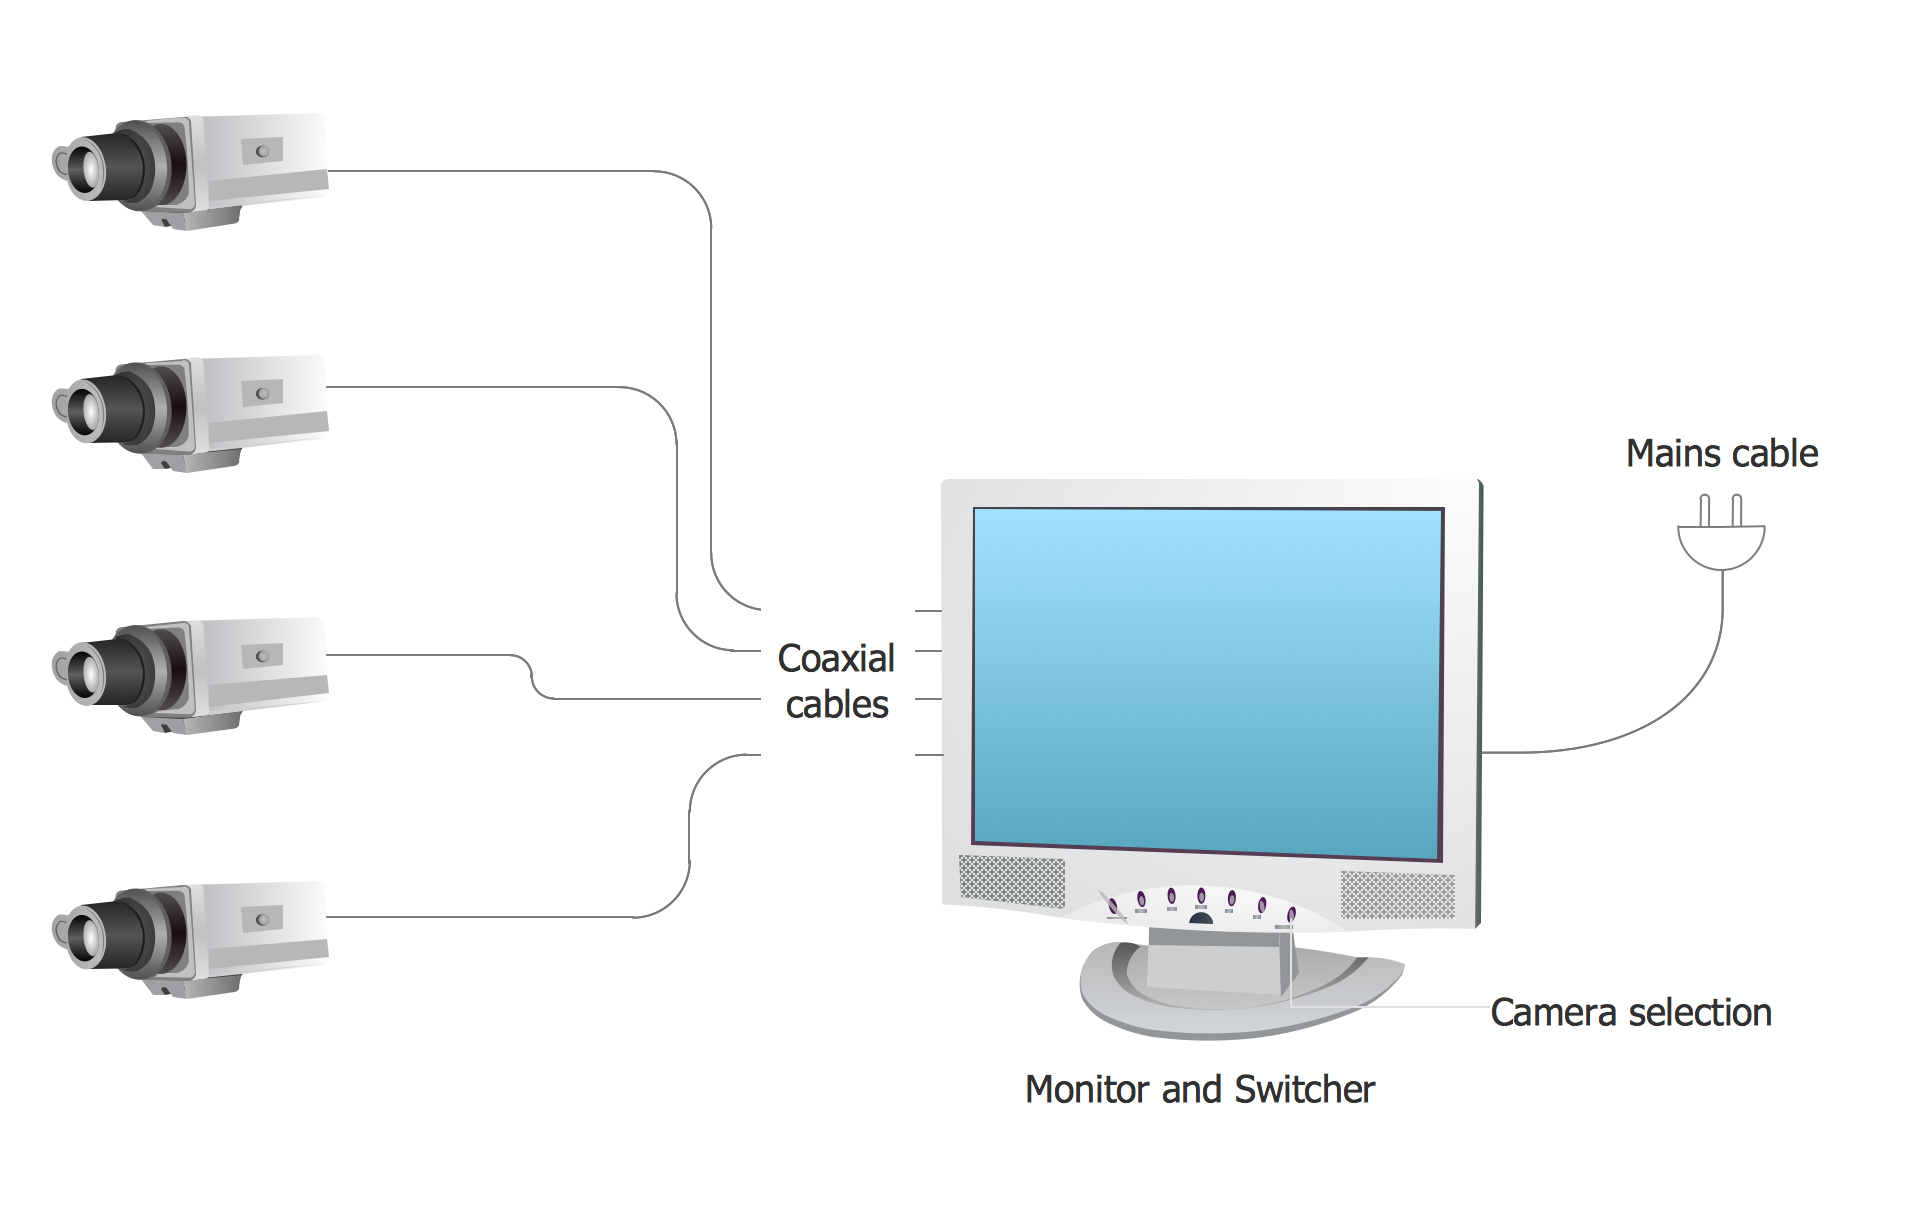
Picture: Basic CCTV System Diagram. CCTV Network Diagram Example
Related Solutions:
The Audio & Video Connectors solution contains a set of pre-designed objects, libraries, templates, and samples; allowing quick and easy diagramming of various configurations of audio and video devices.
Picture: Audio and Video Configurations
Related Solution:
Use the ConceptDraw DIAGRAM software that has vector clipart of numerous cable connectors, examples, and templates for drawing different types of audio and video connection diagrams. Paste icon of the receiver or another device to page and layout sockets and plugs. Further connect plugs with each other, and now you have well-designed connection diagram.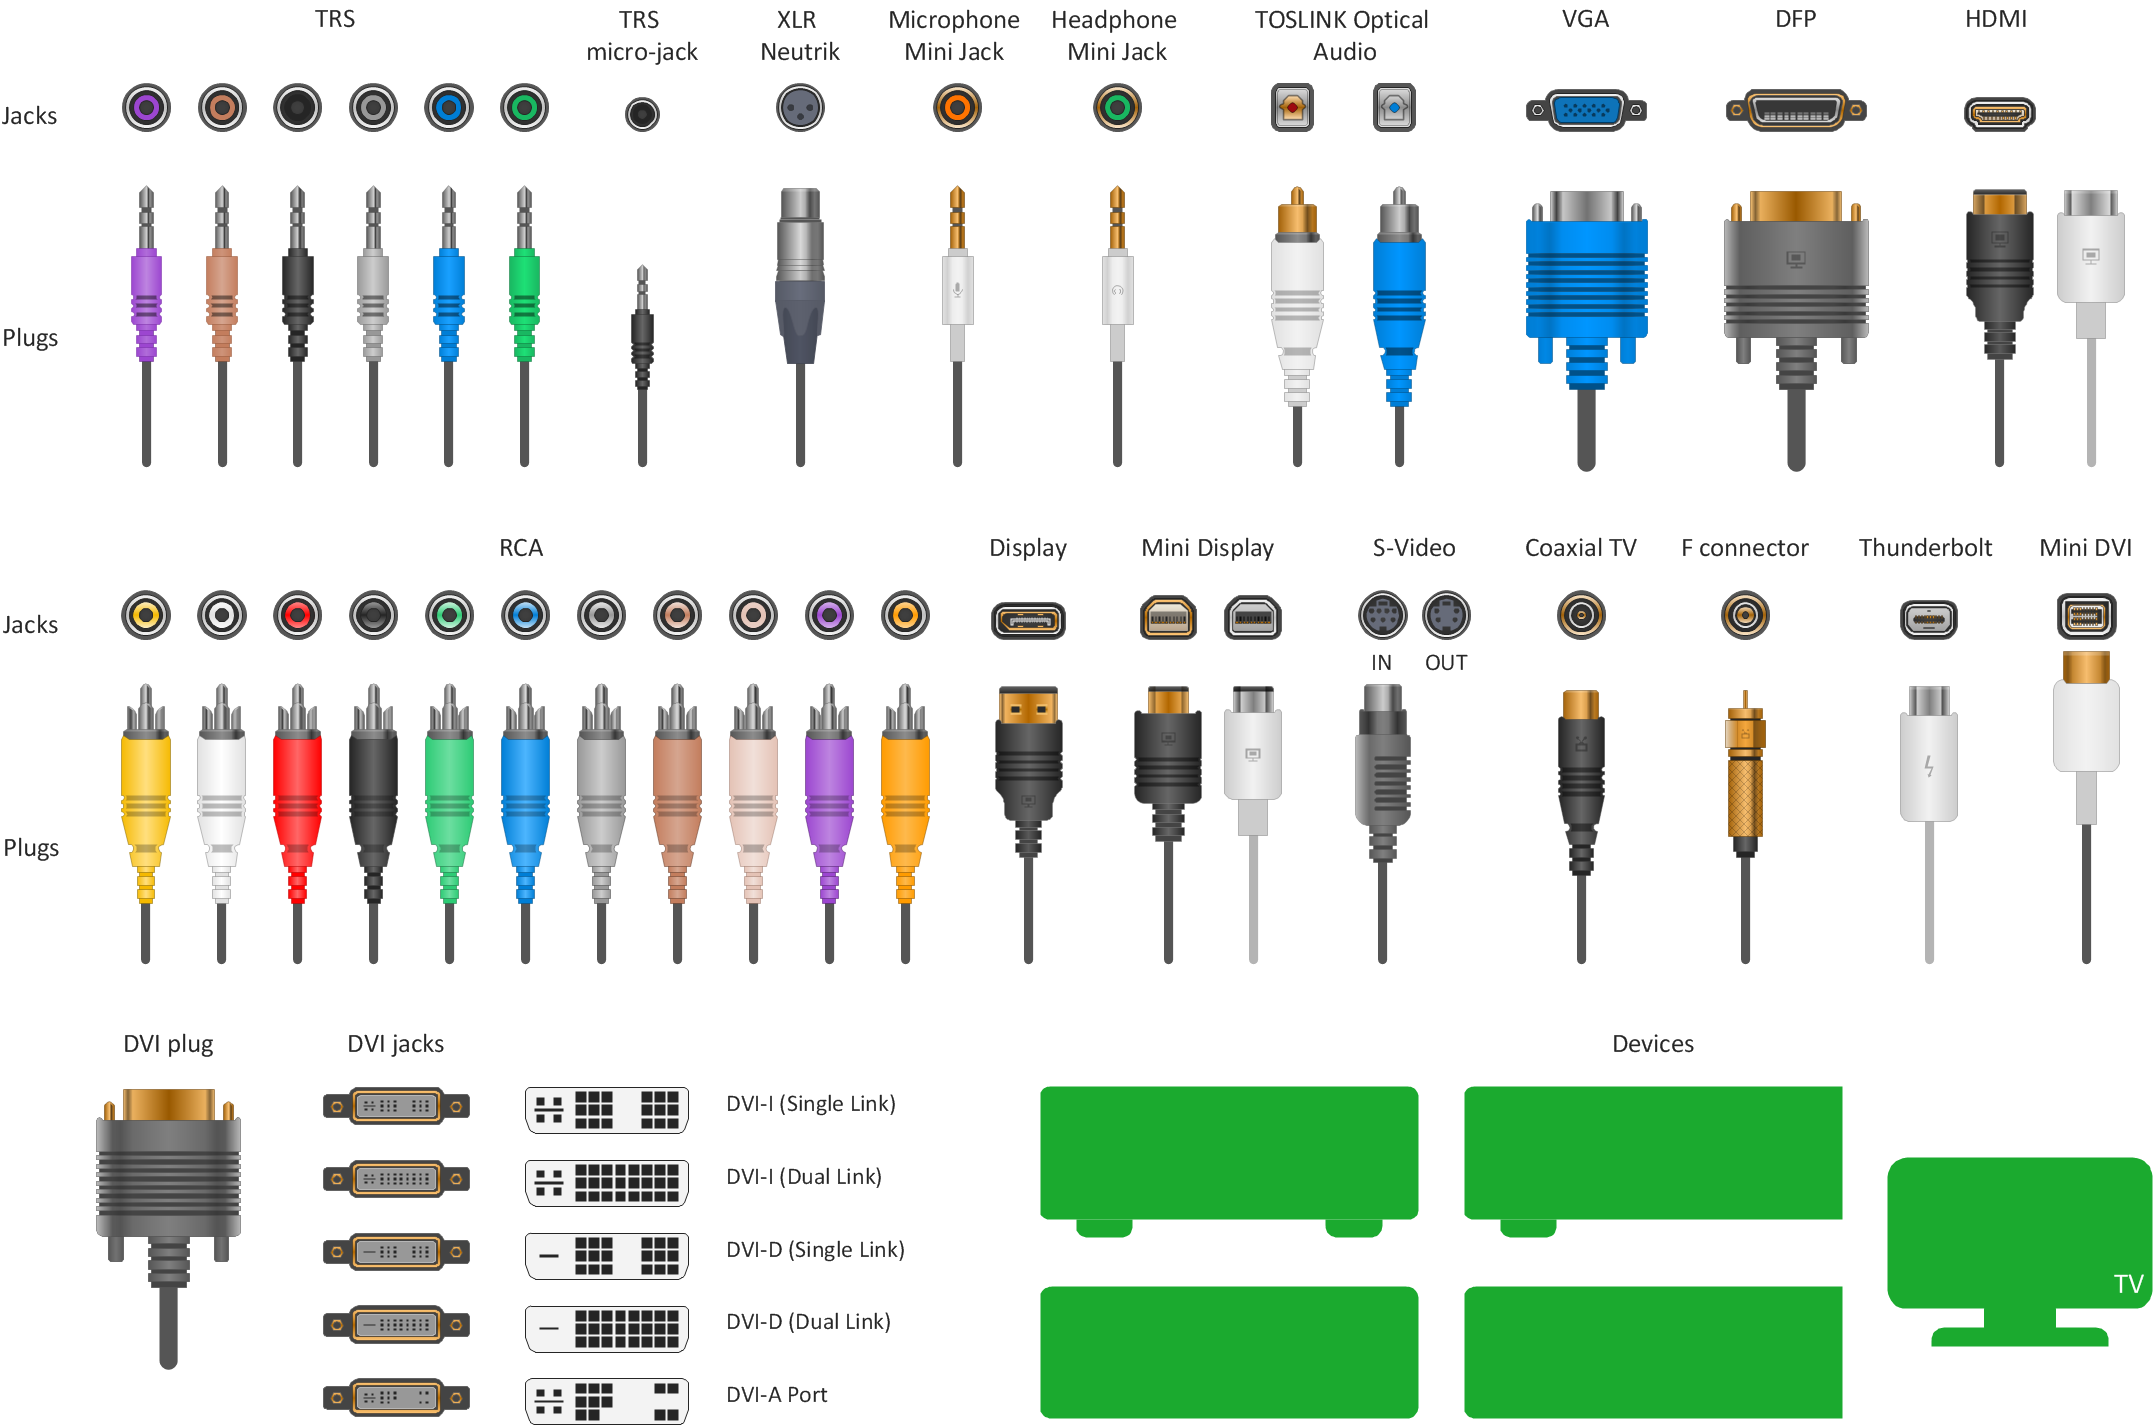
Picture: How to Make Audio and Video Connections
Related Solution:
When thinking about data visualization, one of the first tools that comes to mind is a flowchart design. You can find flowchart symbols, shapes, stencils and icons easily on the Internet, but it might take time to systematize this information. Nevertheless, once you start flowcharting, you’ll love its simplicity and efficiency.
This diagram consists from standard flowchart symbols, approved by ANSI (American National Standard Institute) for drawing flowcharts. A flowchart is a diagram that represents a step-by-step algorithm of any process, displaying the process stages as boxes that are connected with arrows. Flowchart design makes it clear and readable.
Flowchart designed using ConceptDraw DIAGRAM flowchart software allows to make attractive and clear process presentation, it makes interpretation of the business process flow fresh and versatile. Great flowchart design view is a big advantage over the diagram created manually on a paper.
Picture: Flowchart Design: Principles, Layout, Symbols and Best Practices
Related Solution:
ConceptDraw
DIAGRAM 18