
The vector stencils library "Instruments" contains 72 symbols of control
instruments and measuring devices: meters and gauges , and callouts, text boxes,
and inserts. Use these shapes to create annotated process flow diagrams (PFD),
flow control, manufacturing processes, and distribution system diagrams in the

The vector stencils library "Meter indicators 2" (for dark background) contains 29
Live Objects: speedometer gauge , dial, bullet, slider and level meter visual
indicators. The Live Objects designed to display actual measures of performance
metrics from external data source files. Some of them also display comparative

The vector stencils library "Management indicators" contains 14 visual indicators.
Use it to create your management infogram in the ConceptDraw PRO
diagramming and vector drawing software. The example "Management indicators
- Vector stencils library" is included in the solution "Marketing infographics" from
the

Speedometer Gauge 1, speedometer, gauge ,. Speedometer Gauge 2.
Speedometer Gauge 2, speedometer, gauge ,. Speedometer Gauge 3.
Speedometer Gauge 3, speedometer, gauge ,. Speedometer Gauge 4.
Speedometer Gauge 4, speedometer, gauge ,. Slider Horizontal 1. Slider
Horizontal 1, slider,. Slider Horizontal

Progress bar. Progress bar, progress bar indicator, discrete horizontal level
indicator,. Radial gauge . Radial gauge , radial gauge indicator, speedometer
indicator,. Semi-radial gauge . Semi-radial gauge , semi-radial gauge ,
speedometer gauge ,. Square chart 10x10 - filling from above. Square chart
10x10 - filling from above,

The vector stencils library "Meter indicators" contains 29 Live Objects:
speedometer gauge , dial, bullet graph, slider and level meter visual indicators.
The Live Objects designed to display actual measures of performance metrics
and KPIs from external data source files. Some of them also display comparative
measures, and
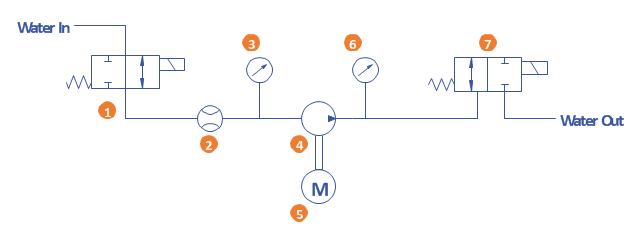
A simple hydraulic schematic showing apparatus for testing the strength of a
hydraulic hose splice. Water enters through normally closed solenoid valve (1)
and passes through intake flow meter (2) to high pressure pump (4). Intake water
pressure is monitored by pressure gauge (3). The hose to be tested connects
between

This sale dashboard example contains KPIs and sales effectiveness metrics
visual indicators: speedometer gauge , dial, slider, level meter and bullet
indicators. "Sales effectiveness refers to the ability of a company's sales
professionals to “win” at each stage of the customer's buying process, and
ultimately earn the business

This sales performance dashboard example includes KPIs indicators and
business metrics charts: bullet indicator - "Win Ratio vs. Last Year", gauge (
speedometer) indicators - "Open Deals vs. Last Year" and "YTD Sales vs. Last
Year", column chart - "Leads created", line chart - "Opportunities Won", alarm
indicators - "Sales
- Symbol For Pressure Gauge
- Meter Dashboard | Sales Dashboard | Excel Kpi Gauge Template
- Dashboard Gauges
- Project Gauge
- Sales Dashboard | Gauge Chart Templates For Word Powerpoint Pdf
- Ready Gauge Chart In Excel
- Strain Gauge Drawing Symbol
- Meter Gauge Symbol
- Meter Dashboard | Level Gauge In Excel
- Gauge
- ERD | Entity Relationship Diagrams, ERD Software for Mac and Win
- Flowchart | Basic Flowchart Symbols and Meaning
- Flowchart | Flowchart Design - Symbols, Shapes, Stencils and Icons
- Flowchart | Flow Chart Symbols
- Electrical | Electrical Drawing - Wiring and Circuits Schematics
- Flowchart | Common Flowchart Symbols
- Flowchart | Common Flowchart Symbols