The vector stencils library "Divided bar diagrams" contains 12 templates of divided bar diagrams for visualizing percent composition of one total consists of few components.
Drag the template from the library to your document and enter your data.
Use these shapes to draw your divided bar diagrams in the ConceptDraw PRO diagramming and vector drawing software.
The vector stencils library "Divided bar diagrams" is included in the Divided Bar Diagrams solution from the Graphs and Charts area of ConceptDraw Solution Park.
Divided bar diagram (orange)
-divided-bar-diagrams---vector-stencils-library.png--diagram-flowchart-example.png)
Divided bar diagram (orange) 2
-2-divided-bar-diagrams---vector-stencils-library.png--diagram-flowchart-example.png)
Divided bar diagram (blue)
-divided-bar-diagrams---vector-stencils-library.png--diagram-flowchart-example.png)
Divided bar diagram (blue) 2
-2-divided-bar-diagrams---vector-stencils-library.png--diagram-flowchart-example.png)
Divided bar diagram (green)
-divided-bar-diagrams---vector-stencils-library.png--diagram-flowchart-example.png)
Divided bar diagram (green) 2
-2-divided-bar-diagrams---vector-stencils-library.png--diagram-flowchart-example.png)
Divided bar diagram (aquamarine)
-divided-bar-diagrams---vector-stencils-library.png--diagram-flowchart-example.png)
Divided bar diagram (aquamarine) 2
-2-divided-bar-diagrams---vector-stencils-library.png--diagram-flowchart-example.png)
Divided bar diagram (gray)
-divided-bar-diagrams---vector-stencils-library.png--diagram-flowchart-example.png)
Divided bar diagram (gray) 2
-2-divided-bar-diagrams---vector-stencils-library.png--diagram-flowchart-example.png)
Divided bar diagram (table)
-divided-bar-diagrams---vector-stencils-library.png--diagram-flowchart-example.png)
Divided bar diagram (table) 2
-2-divided-bar-diagrams---vector-stencils-library.png--diagram-flowchart-example.png)
Sales Process Flowchart Symbols

Professional Diagram and Flowchart Software

HelpDesk
How to Draw a Fishbone Diagram with ConceptDraw PRO

Workflow Diagram Template

Emergency Plan


Process Flowchart


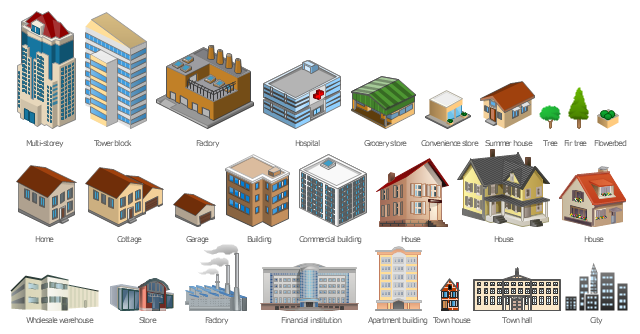
The vector clipart library Buildings and green spaces contains images of buildings, trees and lawns. Use it to design your own illustrations, diagrams and infographics using the ConceptDraw PRO diagramming and vector drawing software.
"Residential buildings are called houses or homes, though buildings containing large numbers of separate dwelling units are often called apartment buildings or apartment blocks to differentiate them from 'individual' houses. Houses may also be built in pairs (semi-detached), in terraces where all but two of the houses have others either side; apartments may be built round courtyards or as rectangular blocks surrounded by a piece of ground of varying sizes. Houses which were built as a single dwelling may later be divided into apartments or bedsitters; they may also be converted to another use e.g. an office or a shop. Building types may range from one-room wood-framed, masonry, or adobe dwellings to multi-million dollar high-rise buildings able to house thousands of people. A Multi-Storey is a building that has multiple floors above ground in the building." [Building. Wikipedia]
The exampe "Design elements - Buildings and green spaces" is included in the Artwork solution from the Illustration area of ConceptDraw Solution Park.
Vector clip art
AWS Simple Icons for Architecture Diagrams

UML Use Case Diagram Example Social Networking Sites Project

Fishbone Diagram Design Element
.png "Fishbone Diagram Design Element")
Coloring Graphs

Best Program to Make Diagrams


 Line Graphs
How to draw a Line Graph with ease? The Line Graphs solution extends the capabilities of ConceptDraw PRO v10 with professionally designed templates, samples, and a library of vector stencils for drawing perfect Line Graphs.
BPR Diagram. Business Process Reengineering Example

- Green Development Diagram
- Diagram Of Green Marketing
- Process Flowchart | Marketing Diagrams | Cloud marketing diagram ...
- Green Marketing Diagram
- Green Marketing Management Diagram
- Model Diagram O Green Marketing Mix
- Green Project Management Diagrams
- Pie Chart Software | Process Flowchart | Pyramid Diagram | Explain ...
- Perfect Diagrams For Green Marketing
- Process Flowchart | Buildings and green spaces - Vector stencils ...
- Flowchart Of Green Computing
- Basic Circular Arrows Diagrams | Circular Arrows | Circular Arrow ...
- Picture For Graph In Green Marketing
- Design elements - Buildings and green spaces | Design elements ...
- Enterprise Architecture Diagrams | Example of DFD for Online Store ...
- Internet marketing professions | Green Banner Png
- Diagrams Of Green Chemistry
- Describe The Green Marketing Pie
- Divided bar diagrams - Vector stencils library | Divided bar diagrams ...
- Pie Chart Of Green Market Recent In 2016